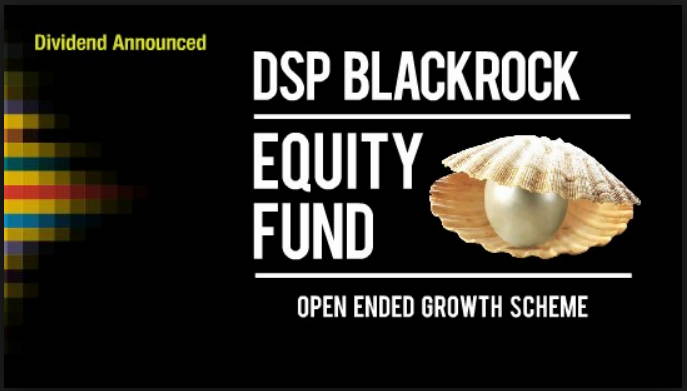
Let’s see a good Equity Diversified mutual fund today, DSP Black Rock Top 100, is an old fund, Its name was DSP ML Top 100 earlier, but now its renamed. It comes from one of the best Mutual funds houses DSP Black Rock.
The fund has very good record and consistently outperformed its Benchmark. To get more information see here
Returns
If you see last 1 years returns its only -35%, which is much better than others who have given close to -50% return.
1 yrs : -35%
3 years : 1.2%
5 years returns : 15%
Since Inception : 29%
It has consistently outperformed its category average by good difference. Which is one the evaluating criteria.
Portfolio
Its portfolio is well diversified with high concentration on Large cap companies (50%), which is good.
Derivatives usage : There is one point to note in the portfolio is that the fund also uses tries to take advantage of Futures (derivatives). This is a smart action, considering Fund manager understand the risks. Else it can be disaster.
Rating
Its rated as 5 star fund and is places in Low risk High Return Grade by value research online. Though we should not put lot of focus on ratings, its one of the things to look at.
Conclusion : Overall the fund looks good. We have not done any detailed analysis but see it in a way which should be done at the minimum level by an average investor. The main thing is not the product, its the usage and utilization . You can take a normal fund and make most out of it using SIP and portfolio re balancing.
Please do your own findings and see if the fund fits your risk-appetite and criteria. People who want to invest money for atleast 3-5 yrs and without putting lot of efforts on monitoring the market , can invest there money using SIP in this Fund.
Keep the money invested for at least 3-4 yrs, and keep monitoring the fund performance minimum once every 6 months.
If you want to check one of my favorite scenes from movie “Socha na Tha”, see this
Long term investments are the investments that are suppose to be held for an extended time period which will be considered to be more than 1 year.
There is no exact definition for long term investments. Let’s see how it is different from short term and medium term investments.
How long is long term ?
There are mainly 3 time frame in markets
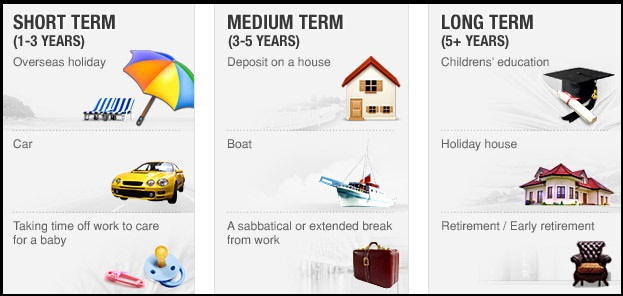
Short term (6 months – 2 yrs)
Medium term (2 yrs – 8 yrs)
Long Term (8+ yrs)
We are taking about long term investing from point of view of Investor , which invests in a company on the basis of fundamentals and valuations .
Time Frame is a relative term , Short term for some one can be medium term for some one and long term for other . similarly if some time duration is long term for you , it can be short term for someone else .
I have also written a small post on IDBI FORTIS WealthAssurance ULIP , Read it
But here we are talking about an average investor . So lets look at predefined tenures .
from my understanding, any time frame less than 6 months shall be considered as trading Time frame . Traders are people who like to take advantage of short term price movements based on news , Charts patterns etc .
One thing you must understand before hand is that Risk and returns are proportional , If you take high risk , there are chances of high Returns.
Now , lets see different time frames .
Short Term (6 months – 1 yrs) :
Any investment made from 1-3 yrs should be considered as short term .
Risk/Return Potential :
VERY HIGH .
Investing for short term :
Invest for short term only if you can afford take the risk. Its always good, not to invest for short term for any goals which are very important. Like for example, if you are going to have an operation or a marriage after 1 years, don’t put your money in stock markets for less than a year to gain extraordinary gains .
Its for professionals , not for an average investor. do it if you can afford to risk loosing it.
Low risk Short term investment option :
Corrections in a BULL RUN : If there is a BULL Run, wait for a correction, It happens many times that there is some correction in stock markets , At that time you can do some investments for short term like 6 months – 1 yrs. Invest only when markets start rising again .
Have a level in mind where you will take loss if it goes against you. There is no guarantee of profits ever. If you are in profit after 6 months, take your profits and get out, don’t convert your short term investment in long term one, One who can not be loyal to his plan in markets will eventually loose it all some day.
Same thing can be applied to short selling in corrections in Bear markets.
Example : In April 2005 , Oct 2005 , June 2006 , there was very good correction, after which it gave 30-40% returns within 6 months – 1 yrs.
If you want to understand the short term and long term in share market, watch the video given below:
Medium Term (1 yrs – 3 yrs) :
Any investment made from 2-8 yrs should be considered as Medium term .
Risk/Return Potential : HIGH/Medium :
Higher the tenure , lesser the risk .
Also it depends on the situation , there is again no guarantee , There can be some time , when there can be high risk in 3 yrs and some time it can less , but over all it should be less than the short term investment .
Investing for Medium Term :
You should invest for medium term for goals like Car , Vacations , etc and some part of portfolio for House , etc (close to 5+ yrs , not 2 yrs) . Choosing well diversified portfolio and investing in strong fundamentals is extremely important . Good timing is always important in any time frame .
But its difficult to time the market .
Low risk Medium Term Investment Time :
After a Bear Market is there for some time around, and markets have fallen considerably, you can start accumulating good stocks with good valuations every month in installment. Don’t jump and put all your money at once ,just because you feel, “now markets have fallen much”, Markets are supreme and you are no one to “feel” or “tell” markets movements.
Just expect it to come back soon and now start accumulating good shares , or start a SIP. There is no guarantee of any profits, we are just discussing the low risk opportunities here.
Read why SIP helps in falling and Volatile markets , Part 1 and Part 2
Example : Current time . This is an excellent time to start accumulating fundamentally good stocks in installments over next couple of months , especially a big chuck should be invested when there October lows are breached within some days ,which is expected with high chances .
Long Term (8+ yrs) :
Any investment made from 2-8 yrs should be considered as Long term .
Risk/Return Potential :
LOW , By Low do not think that we are saying you will get lower return , we are talking about CAGR, obviously the CAGR you can expect over long term is lower than the CAGR which you can expect in short term or medium term, but more important is the risk, the loss potential, and that is extremely low here, almost Nil i would say, This I am saying on the basis of past historical data.
Loss is possible but chances are very bleak .
Investing for Medium Term :
You should invest for Long Term for goals like Retirement , Child Education , Children Marriage or any financial goal which is to be taken care of after 8+ years , Do it using SIP .
Low risk Long Term Investment Time :
Ideally speaking, you can start doing this any time without seeing the current situation of market, because over long term it would matter less that when you entered markets. This does not mean that timing is not important in growth of money, obviously, If you enter neat the end of bear market or at some other important time, it would help .
But the point here is that , it would not harm if you start investing for long term at any time frame assuming that you are diversifying it well across sectors and stocks and also apply some extremely beneficial techniques like Portfolio rebalancing over this long tenure .
Don’t get scared by these words ,they are extremely easy to understand things and can be applied by anyone , and it does not take much time also , The only thing required from investor is the his share of determination to do all this .
What ever i have talked about here are my personal views and my own idea of short term, medium term and long term. It can differ from people to people with different risk – appetite. Also understand that deciding your time frame is important to deal with the situation in markets after investments.
For example: if you decide that you are investing your money for your retirement which is going to come after 25 yrs, then it would be really easy for you to digest the volatility of markets and to see it going down while you invest. So know your time frame and invest it smartly at correct time.
Don’t try to get smart and get greedy. Markets are the place where Albert Einstein and Issac Newton also failed and returned to try what there were good at. That does not mean we will also fail. try to made fast money, in fact try to make smart money.
For new comers in this area, its advisable not to enter through Direct equity, better go though mutual funds, and please listen to people when they tell you all this, don’t get smart, else you will be ruined like millions others.
I have also written a small post on IDBI FORTIS WealthAssurance ULIP, Read it
This post is for people who are interested in Stock markets trading, SudarshanSukhani has posted an excellent presentation on Swing Trading here, please go through it and use it incase you want to do it.
Who should use this presentation for Trading ?
This presentation is only for people, who are already experienced with Trading, no matter they make Profit or Loss. You must have some level of knowledge and experience before.
Especially for people who are trading and are yet to succeed in Trading (Whether its Stocks , Futures or Options , it may be currency or Commodities also). I also come in this “overall loss making” category of traders till now. I am yet to break even and start making some profits in Trading.
Who should not start using this presentation just after seeing this presentation ?
Anyone who is not at all related to trading and just want to start Trading. If you have not done it before, Just look at it and stay away as of now. You are yet to gain more knowledge and then enter this world, You yet need to understand what is Money Management, Trading Psychology, Technical Analysis etc etc.
If you don’t listen to me and start using the techniques given in this presentation, there is extremely high possibility that you loose blow up your account at some point of time, Just see this presentation, get the feel and save it for future reference.
In this article we will talk about RBI relief Bonds. Some bonds have a special provision that allows the investor to save on tax. These are termed as Tax-Saving Bonds, and are widely used by individual investors as a tax-saving tool. Examples of such bonds are:
Infrastructure Bonds under Section 88 of the Income Tax Act, 1961
Capital Gains Bonds under Section 54EC of the Income Tax Act, 1961
RBI Relief Bonds are instruments that are issued by the RBI, and currently carry an 8.5 per cent rate of interest, which was reduced from 9 per cent early this year. The interest is compounded half-yearly. Maturity period of RBI Bonds is five years, and interest received is tax-free in the hands of the investor.
INVESTMENT OBJECTIVES
How Suitable Are RBI Relief Bonds For An Increase In My Investment?
RBI Bonds are not very suitable if you are looking for an increase on your investment. Since RBI Bonds carry interest @ 8.5 per cent, capital appreciation is better in other safe instruments that offer a higher rate of return.
However, if safety is of paramount importance to you, you couldn’t ask for a better deal as this is the safest instrument to invest in. In case of the cumulative option, bonds issued at a face value of Rs 1,000 are redeemed at Rs 1,516.
Are RBI Relief Bonds Suitable For Regular Income?
Yes, you can opt to receive interest either on a half-yearly basis or on maturity of the instrument, along with the principal invested.
If you opt for the first option, i.e., to receive interest on a half-yearly basis, you will receive interest every six months from the date of issue of the bond up to 30th June or 31st December, whichever is earlier. Interest is paid on 1st July and 1st January each year.
To What Extent Do RBI Relief Bonds Protect Me Against Inflation?
Yes, you can borrow against RBI Bonds by pledging them as security in a bank.
RISK CONSIDERATIONS
How Assured Can I Be Of Getting My Full Investment Back?
RBI Bonds are issued by the country’s central bank, the Reserve Bank Of India. These are among the safest instruments available for investment, and you can be assured of getting back the full amount of your investment.
How Assured Is My Income From RBI Relief Bonds?
Your income from RBI bonds is assured. Since the issuing entity is the country’s central bank, the risk on this investment is nil. In case of the half-yearly interest payment option, the rate of return is 8.5 per cent.
In case of the Cumulative Scheme, where you receive the total interest at the end of the tenure of 5 years, the simple interest works out to 10.32 per cent at the end of the tenure.
Are There Any Risks Unique To RBI Relief Bonds?
No, there are no risks associated with your investment in RBI bonds. This is one of the safest investments you can make. Inflation and fluctuations in interest rates affect investment decisions in RBI Relief Bonds. An increase in the interest rates result in a decrease in bond prices, and vice-versa, if you want to sell them in the secondary market.
Are RBI Relief Bonds rated for their credit quality?
No, since the issuing party is the country’s central bank-the RBI-these bonds are extremely safe, and require no commercial ratings.
BUYING, SELLING, AND HOLDING
How Do I Buy RBI Relief Bonds?
Application forms for RBI Bonds are available and accepted at all branches of the Reserve Bank of India, designated branches of the State Bank of India, and designated branches of nationalised banks across the country.
What Is The Minimum Investment And The Range Of Investment for RBI Relief Bonds?
The minimum investment on RBI Relief Bonds is Rs 1,000. You can apply in multiples of Rs 1,000 thereafter. There is no prescribed upper limit to your investment in this instrument.
What Is The Duration Of RBI Relief Bonds?
The period of holding of RBI Bonds is five years from the date of issue. The bonds are repayable on the expiration of 5 years from the date of their issue.
Can RBI Relief Bonds Be Sold In The Secondary Market?
Yes, the bonds can be sold or transferred to another party. If the bonds are in the form of Bond Ledger Account (BLA), they can be transferred by execution of a Transfer Deed in the prescribed form. However, transfer shall not be deemed as complete until the name of transferee is registered as holder of the Bond in the Office of Issue.
A new BLA will be opened in the name of the transferee (whom the bond has been sold to) for the remaining period by closing the BLA of the transferor (original holder of the bond). The Bond in the form of Promissory Note (PN) will be transferable by endorsement and delivery.
What Is The Liquidity Of RBI Relief Bonds?
While RBI Bonds cannot be redeemed prematurely and must be held for the entire duration of 5 years, you can always exercise the option of selling RBI Bonds in the secondary market if you so desire.
How Is The Market Value Of RBI Relief Bonds Determined?
Market value of RBI Relief Bonds is determined on the basis of prevailing (8.5%) interest rates and market conditions.
What Is The Mode of Holding RBI Relief Bonds?
RBI Relief Bonds can be held at the credit of the holder in an account called BLA or in the form of PN. The bond can be held in demat form, i.e., a certificate of holding will be issued to the holder of bonds in the BLA.
The bonds in the form of BLA are issued and held with the public debt offices of the RBI or any branch of a scheduled bank authorised by the RBI. The bonds in the form of PN are issued only at the offices of RBI. However, bonds issued in one form will not be eligible for conversion into the other.
TAX IMPLICATIONS
Interest received on RBI Relief Bonds is completely exempt from income tax as per the provisions of the Income Tax Act, 1961. RBI Relief Bonds are also exempt from Wealth Tax. However, there is no tax benefit on the amount invested in these bonds.
Hope you liked this article. Leave your views about this article or any query if you have in our comment section.
Some days back I had talked about SIP and its characteristics using some examples , you can read it here . Today we will take that forward and see other important things related to Systematic Investment Plan.
So , We have that same last example where 1,00,000 was invested over 2 years using Systematic Investment Plan and without SIP in UNITECH. Can we measure how good our investment is at any point of time . For that I developed a simple indicator called IV ratio which is very simple , Its just the ratio of Your total investment divided by its current Value at any given point .
IV ratio = Current Value / Investment
So if your investment = 10k , has current value of 8k , IV ratio = .8 , If current value is 15k , IV ratio = 1.5
I have plotted a graph of IV ratio in two cases of SIP and NON-SIP . You can clearly see in the graph that , IV ratio for Systematic Investment Plan was always more than non-SIP mode.
At first , IV ration was declining for both mode, which is fine, because of falling markets, but still For Systematic Investment Plan it was high, which means, that you get better returns. Then in last part, when markets were volatile, IV ratio for non-SIP was stable, but for SIP it went up, which means that SIP was giving better returns at this point.
Finally Systematic Investment Plan mode generated worth of around 42k (IV = .42) and Non-SIP gave around 9k ( IV = .09)
Conclusion :
IV ratio is a simple tool to measure the performance of your investment. You can also use it to compare two different Investments mode over a period of time.
Now, let us see some other things in regard to Systematic Investment Plan. I have plotted the graph for IV ratio of SIP, and the investment value itself scaled down to 1. Blue line is the actual growth of investment and RED line is the IV ratio.
Some of the things to Notice here are
1. In the start (till 17-18) Investment was going up, but IV ratio was falling, which indicates Growth in value mainly because of your Monthly inflow in SIP, that means the markets are falling and eroding your investment, but the decrease in value is less than your monthly addition which you make.
2. From 18 payment onwards, you investment and IV ratio both are falling, which means that markets are falling at very high rate and your monthly contributions are smaller than the decrease in your portfolio.
3. from 31st payment onwards, you can see that IV ratio and your investment were going up, which means volatile and sideways market or small upside correction on up side.
At last, you can see that both the value converge to same value of .42, which is your IV ratio and your actual investment value, Because at this point total investment is 1,00,000.
Conclusion
IV ratio is the measure of how well your investment is doing in a given market, If its higher than yours friend, you can feel better because your have lost less for your investments. SIP results in higher IV ratio in markets which are not going up too fast.
Which means apart from fast moving markets on upside it makes sense to invest through SIP only. It protects you from volatility, develops from discipline, and your are more satisfied mentally.
Precious metals market is on a roll these days !! GOLD and SILVER are everyone’s Darling.
GOLD
Gold has given good returns from this year start and finally broke its trading range. Its expected to give good returns in future too.
SILVER
Silver has outperformed Gold in 2008 and is expected to do so in future too. But I am hesitant with an idea of buying Silver from some local jeweler. It should be bought from some recognized Bank only as per my view.
I don’t think that its a good idea to buy gold or silver in physical, People who want to do it to invest for marriage and all is OK, but still its only for Investment and to gain from the price appreciation in these metals, the best idea would be to go for ETF’s. They are easy, secure, more cost-efficient and tax efficient.
Some Notes
Silver ETF’s are still to come, currently we only have GOLD ETF’s, so given a choice of investments in precious metals, I would prefer GOLD ETF to Physical Silver even though Silver is expected to outperform GOLD in coming future.
Guys, When it comes to ETF’s, Benchmark mutual funds are the leaders, that company mainly focuses on ETF’s and manage them in a better way. So there ETF’s are recommended. (that does not mean, others are not good or can outperform them).
Today we will see some characteristics of SIP (Systematic investment plans) . this is first part of this article, we will have part 2 of this as well where we will discuss other important things about SIP.
Assumption :
We are assuming that investments were started from year 2007, It has both a part of Bull markets and Bear market, So i chose that time frame.
Let us first see an example where investment was made in NIFTY ETF’s. There are two friends Ajay and Robert. Both of them want to invest Rs.50,000 in markets with 2 yrs of time frame in mind. Both of them do not have that much cash in the start.
Robert believes that Markets are in Bull run and hence it has good chances of Capital appreciation. He does not want to miss this chance and decides to borrow money on loan from friends and family or personal loan and invest it.
What are his Characteristics at this point?
Its just like any normal, average investor, where investment decisions are based on emotions, without foresight and too narrow. They do not understand the cycles of market and they do not understand that markets moves up and down in every time frame.
On the other hand Ajay is an informed investor and does understand cycles of Market, He knows that markets run from up to down and the bull market which started in 2003-04 has already run a long way and can turn any time now. He understands that its a better idea at this point to not get into debt to invest in stock markets. He controls his Greed and will invest only what he has. Also he decided to invest 50,000 in 2 yrs. but a small amount month by money systematically.
Now lets see the capital appreciation which happened for both of them.
Summary :
Robert invest full 50k in the start around Jan 2007 with 2 yrs of time frame. Ajay also decides to invest the same amount but he breaks it in smaller chunks and wants to do it using SIP on his own.
Monthly Investment Growth in NIFTY ETF from Jan 07 – Jan 09 for Rs.50000
Lets look at what happened ?
Markets continue to rise and Robert sees his investments grow from 50k to 75k within a year. Ajay also sees his money grow to 35k, on an investment of 25k. If you see at this point, Robert has made very great returns on his investment compared to Ajay.
But after that see what happened. Markets started going down and investment of Robert kept coming down with markets and at the end it was at 35k. With Ajay it was a different case. His investments went up and down both sides and finally ended at same point at 35k.
What is Drawdown ?
Drawdown is the drop in the value of investments from its High. If 10k investment go up to 15k and then fall back to 12k. The drawdown is High(15k) – Lowest point after that (12k) = 3k, OR 20% drawdown.
Things to notice
Roberts Portfolio :
You can see the behavior of Robert’s investments. It was too volatile. You can see it going up and down and here and there. I am not saying that it didn’t move and made profits, It made good profits at one point of time, but Robert must be smart enough and courageous to take his profits even if markets are going up and there are chances of making more.
People who want “more” and “more”, eventually not even get “what they had”. Have a target and BANG !! Once it moves at that point, be unemotional and take the profits. Markets is a place where money is flesh and everyone is Vultures. If you leave it open for a long time, It will be taken by some one of other.
The other thing is Psychological issue.
Because investment moved so high, and then so low, Robert must be feeling bad and too conscious. He must be regretting a lot on not taking the profits. This has bad effects on investment decisions.
Roberts Drawdown :
His 50k goes up to 75k (high) and then it moves down to 38k. Draw down of 41k which is 49.3%, this can have devastating affect mentally, as one sees his investment grow to 75k and then drop to 38k and finally end at same point 38k after some volatile movement up and down.
Ajay Portfolio :
You can see the consistency of Ajay portfolio. It moved up and up all year whee markets where rising. and once markets started going down and was volatile, his portfolio was also volatile, but not very high, Its volatility was very low and finally it was almost at the same point as in the start of the year.
Infact you can see that his portfolio was rising still when Roberts was declining.
Ajay’s Drawdown :
This highest Drawdown seen by Ajay portfolio was from high of 39k (20th payment) to low of 35k, which is just 10.25% drawdown. You can get a feel, How difficult or easy it must be for Ajay to see this.
The point here is not Who made more money or Lost more. Infact you can see that they both were in loss of 12k on an investment of Rs.50k, But the journey was not same for both of them.
While Robert worked too hard and saw wild swings. Ajay made systematic investment and continuously saw his money go up only with minor drawdowns, which was easy to handle psychologically. This is true for any investments weather it is Shares, Mutual funds or ULIPS investments.
Now’s let see and example for the same period, weather these two same investors have made investment in UNITECH.
Why UNITECH?
I have taken this example because it shows what I want to show, the power of systematic investment. Here both of them are investing Rs.1,00,000 (1 lac) in Shares of Unitech. Roberts invests 1 lac in the start of Jan 2007, where as Ajay makes weekly investment of a fixed amount in such a way that it adds up to Rs.1,00,000 at the end of 2 yrs.
You can see the behaviour of portfolio for both of them.
Robert
Investment : Rs.1,00,000
Mode : One time investment
Final Value : Rs 9,000
Time frame : 2 yrs
Drawdown : 91% (Rs 1 lac , from high of 1.1 lacs to low of 10k)
Ajay
investment : Rs.1,00,000
Mode : Weekly investment (weekly SIP by self)
Final Value : Rs.42,000
Time frame : 2 yrs
Drawdown : 70% (28k, from high of 40k to low of 12k)
Weekly Investment Growth in UNITECH from Mar 08 – Feb 09 for Rs.1,00,000
Conclusion :
Now the main question? What is good One time investment or SIP? The answer is both are good inp different conditions, and it depends on your Risk appetite too.
When you don’t have clear indication of trend and are not sure where markets can go, the best idea is to invest through SIP. That will save you from volatile markets and small down moves too.
SIP will definitely miss out on returns in BULL markets. But it will work best in Volatile markets and falling markets. SIP is not a way to avoid losses, its a way of investing, where you feel more disciplined and average your cost of investment of long term.
Watch this video to know the magic of SIP:
The examples I have taken were biased because of the idea I wanted to communicate.
Anyone who did one time investment in 2004 would have made more money than someone with SIP, till 2007 at least because of the rising markets.
You must have seen in first example that Ajay’s portfolio was at 35k in the start of 35k, and even at the end of 2009, it was at same point even though markets fell from 20,000 levels to 10k levels and was too volatile, there comes the power if SIP (the money you pump in fights the falls in markets at least).
Part 2 : This is first part of this article, we will have part 2 of this as well where we will discuss other issues and things regarding the second example we took (UNITECH)
Request from Readers
If you are on twitter, try to post this article there, so that your friends can read it. I also have a small complain from my readers. please recommend this blog to your friends and any one you know and needs it. I feel this blog needs more readership and deserves too. You can help me promote this blog to others, please pass it on to others. Thanks
Also, why don’t you guys and gals leave me messages and comments, please put your comments with your views on article and your own ideas, I should also get chance to learn from you all, don’t I?