95% of the salaried people are rushing to invest in tax saving (India). 5% of smart people have already done it (like me). The biggest rush I know must be still for LIC policies and PPF because very fewer people in India invest in Mutual funds still.

In my earlier posts, I have told which two mutual funds are the best candidate for investing now. They are SBI Magnum tax gain and Sundaram BNP Paribas Taxsaver
Both of these mutual funds are long term consistent performers and come from very respected and best AMC’s in India. Both of these have always been one of the best in the category.
But time changes, situation changes :), We can analyze some numbers and see what are the future prospects for these two mutual funds in comparison to each other. We will see on what basis we can conclude that. Please read the following conversation with my friend. It should give you some idea about how to choose mutual funds and why one could be possible is better than others.
Robert: Hey Manish, need some suggestion from you.
Manish: Hi Robert, what’s up … how is life these days?
Manish: How is a job going on?
Robert: Nothing yaar, I am just busy with my tax savings, have to submit the documents ASAP, so need to invest now, I am thinking of investing in an ELSS, Any suggestions?
Manish: Hmm… See, There are two good funds I think you can invest in, SBI Magnum tax gain and Sundaram BNP Paribas Taxsaver. These are the 5 star rated funds from valueresearchonline.com. You can consider those. But if you only want to invest in one ELSS, I would say go with Sundaram.
Robert: Hmm. Can you give me how you did this analysis and why are you saying that Sundaram looks better than SBI at this moment? I thought if a mutual fund has been long term consistent performer and our time horizon is more than 3-5 years, We can invest in any good funds.
Manish: That is true, I am not saying that SBI is bad and Sundaram is the best, we are trying to see why Sundaram is a better choice for now. We will see the numbers and some charts, and we can look that Sundaram is doing much better than SBI for quite some time.
That gives us a good estimation of which one is good for investing now. So, this requires some long-duration talk, I will have to tell you the details, are you ready?
Robert: ok
Manish: So, Let me first tell you that Since Inception returns for SBI has been 16.67% and for Sundaram its 19.35%, Which is highly respectful .. Let us also look at the following chart of NAV of both mutual funds for last 3 years.
Green: Sundaram
Red: SBI
Blue: Sensex
 Manish: You can see that in the last 3 years, Sundaram has outperformed SBI Magnum and also was less volatile than SBI, when it comes to being consistent with Sensex. Also, we must see the last year charts of these two in isolation.
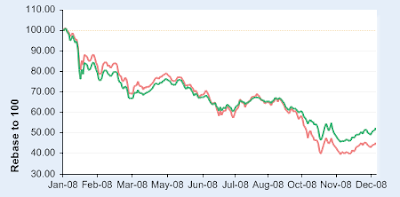
Manish: You can see that Sundaram has taken over SBI around Jun 2008 and has performed better than SBI. You must keep in mind that NAV and index values have been rebased to 100, for comparison purposes only.
Robert: Hmm.. that is fine, I understood that we have some charts which try to prove the point, But there must be other numbers also which favors Sundaram over SBI.
Manish: Yes, let me tell you some things which you can use for comparison purposes.
1. Sharpe Ratio:
Generally, people judge mutual funds performance by the returns only, whereas the better parameter is Return with respect to the risk taken. The Sharpe Ratio of a fund measures whether the returns that a fund delivered were commensurate with the kind of volatility it exhibited.
This ratio looks at both, returns and risk, and delivers a single measure that is proportional to the risk-adjusted returns.
So, the Sharpe ratio is noting but risk-adjusted returns, So the higher Sharpe Ratio is better. Currently, in the Mutual fund’s industry, Sundaram Tax saver and Canera Rebecco mutual funds have the highest Sharpe ratio of 15. SBI has 0.0.
2. Alpha Ratio:
This is a very important ratio in mutual funds. Alpha is a measure of an investment’s performance on a risk-adjusted basis. It takes the volatility (price risk) of a security or fund portfolio and compares its risk-adjusted performance to a benchmark index.
The excess return of the investment relative to the return of the benchmark index is its alpha.
Simply stated, alpha is often considered to represent the value that a portfolio manager adds or subtracts from a fund portfolio’s return. A positive alpha of 1 means the fund has outperformed its benchmark index by 1%.
Correspondingly, a similar negative alpha would indicate an under-performance of 1%. For investors, the more positive an alpha is, the better it is.
Alpha for Sundaram: 3.35
Alpha for SBI Magnum: -1.18 !! (Bad)
3. R-Squared:
R-Squared is a statistical measure that represents the percentage of a fund portfolio’s or security’s movements that can be explained by movements in a benchmark index.
Higher the R-squared Value, closer the mutual fund to the index, what it means is that it will behave like Index funds up to that percentage, which means what if a mutual fund has r-square value of 100, its nothing but an index fund, then why to buy the mutual fund and pay high managing fees, A mutual fund should have a balance in R-square it should not be more than 90 and less than 80.
A mutual fund with less than 80 R-square shows that they have more tendency to be volatile and be close to the index benchmark. forbes.com says: Mutual fund investors should avoid actively managed funds with high R-squared ratios, which are generally criticized by analysts as being “closet” index funds.
In these cases, why pay the higher fees for so-called “professional management” when you can get the same or better results from an index fund.
R-squared for,
SBI Magnum: 94
Sundaram: 87
Read more about the ratios at :
https://www.investopedia.com/articles/mutualfund/112002.asp
Robert: Great !! those ratios are really important parameters while judging the mutual funds. Btw, I understood these things. Any thing regarding holdings?
Manish: Definitely, Ratios are important, but we should also look at simple things like its holdings in different types of companies. See below –
Sundaram Portfolio
[su_table responsive=”yes”]
| Market Capitalization |
% of Portfolio |
| Giant |
56.17 |
| Large |
17.10 |
| Mid |
24.88 |
| Small |
1.85 |
| Tiny |
— |
[/su_table]
SBI Magnum
[su_table responsive=”yes”]
| Market Capitalization |
% of Portfolio |
| Giant |
46.07 |
| Large |
21.48 |
| Mid |
25.52 |
| Small |
6.91 |
| Tiny |
0.01 |
[/su_table]
If you compare the investments by Sundaram, it has a high concentration in Giant companies and has avoided investments in Small and Tiny Companies, which helps in avoiding Risk (also returns can be affected, but more important is managing risk).
Also in the future when Markets improve and start rising, front line stocks (big companies) will be the first to move up.
Robert: Any other small things to consider?
Manish: Other things you should see are
Expense Ratio (lower the better) : Sundaram : 2,.24 , SBI : 2.5
Market Turnover
PE Ratio: Lesser is better
PB Ratio: Lesser is better, SBI is better in this Market Capitalization There are many other,
Robert: That is fine, but I can see that SBI is ranked 1st when you consider 5 yrs return and Sundaram is 2nd, I saw it on Value research online site.
Manish: True, But did you see its 3 yr Rank also? Its 5th !! and did you see 1 yr rank: its 12th for SBI Where as Sundaram is 2nd in 5 yrs, 1st in 3 yrs and 2nd in 1 yrs return category, which gives an indication that Sundaram is taking over as one of the best funds available over SBI slowly.
Robert: Hmm.. that makes sense, Great !! I would really consider these points, this helped a lot. Manish: My Pleasure !! But please understand that there is no guarantee that Sundaram will outperform SBI next year or from now on. There is just a high possibility for it, because of our analysis.
Question: Guys (and gals) … Do you know who is Robert and Manish 🙂 Ans: Both are Me … :), I just created this talk to present the article and learning in a different way and to make it practical and enjoyable .. I hope you all liked it.
Note: Please note that the views and analysis are personal, there may be some error, if someone finds any please, let me know. I will correct it. But I am sure there is no mistake or error in data.
Source: valueresearchonline.com and forbes.com