Hi Friends, Happy New Year to all of you. As this new year is coming, Let us discuss some things, they are:
1. Financial Resolutions for 2009
2. The outlook of Asset Classes in 2009 and onwards.
Financial Resolutions for 2009
Let us all make sure that we will do better than the previous year and make some changes.
#1. Adopt the attitude of Expenses = Salary – Savings instead of Savings = Salary – Expenses
#2. Learn more and more about investing to at least up to a level, where I can take my decisions without any help of others and also be able to help someone else.
#3. Learn all the basic taxation rules and investing rules.
#4. Not take decisions whose Risk/reward ratio does not suit me, even if there is no risk in some investment, its return should at least match your goals.
Person 1: Person not investing his money in any thing (just putting it in the bank) and having a desire of getting a 15% return and risk appetite of the same.
Person 2: Another person investing in Equity for a return of 50% in a year, but he actually requires and can be fine with a 15% return.
Both the people here are wrong and are not doing correctly. They must invest in a way that satisfies both there return/risk ratio.
#5. Will not get trapped in useless products just because someone else thinks so, we will do our own analysis, take suggestions from reliable sources and people with knowledge and only then invest our hard-earned money.
Outlook and suggestions for Asset classes in 2009
Let us see some asset classes and let’s have a quick view of it.
#1. Mutual Funds: The situation now is little under control, with a downward bias for the first quarter, but things should be good by the year-end and then we can see a good rally there after. Better to invest though SIP only.
#2. Direct Equity (shares): Make sure you buy shares only if you have long term view and do not want to speculate for short term .. You can buy some very good shares now and hold it for the next 5-20 yrs, and I am sure they will return fortune. The best time after 2003 is NOW !! But better buy on dips …
If you want to invest 100, make sure you break it in 3-4 parts and invest on dips … its like following SIP on our own. Metals (safe) and Real estate (little risky for short term) can be a good bet for long term investments.
#3. Real Estate: No comments … There are still chances of further correction … But people who do not want to buy it for investment can still invest if it suits there requirement and budget.
#4. Bank FD’s: People looking for short term investments like 6 months – 1.5 yrs can put their money in FD’s… The interest rates offered are good and with inflation coming down, it will be a fair investment.
#5. Derivatives (Futures and Options): There are many people who are now trying these instruments, do not understand the risk associated, Please understand very clearly that these are Atom bombs in the Finance field … You can either kill yourself with it or make a Killing out of it …
If you want to do it .. better learn about it .. prepare heavily and only then enter .. Else defeat is almost certain. Some of the biggest financial companies have gone bankrupt over night because of derivatives.
See:
The use of derivatives can result in large losses due to the use of leverage, or borrowing. Derivatives allow investors to earn large returns from small movements in the underlying asset’s price. However, investors could lose large amounts if the price of the underlying moves against them significantly.
There have been several instances of massive losses in derivative markets, such as:
The need to recapitalize insurer American International Group (AIG) with $85 billion of debt provided by the US federal government[4]. An AIG subsidiary had lost more than $18 billion over the preceding three quarters on Credit Default Swaps (CDS) it had written.[5] It was reported that the recapitalization was necessary because further losses were foreseeable over the next few quarters.
The bankruptcy of Orange County, CA in 1994, the largest municipal bankruptcy in U.S. history. On December 6, 1994, Orange County declared Chapter 9 bankruptcy, from which it emerged in June 1995. The county lost about $1.6 billion through derivatives trading. Orange County was neither bankrupt nor insolvent at the time; however, because of the strategy, the county employed it was unable to generate the cash flows needed to maintain services. Orange County is a good example of what happens when derivatives are used incorrectly and positions liquidated in an unplanned manner; had they not liquidated they would not have lost any money as their positions rebounded.[citation needed] Potentially problematic use of interest-rate derivatives by US municipalities has continued in recent years. See, for example:[6]
#6. Gold: Gold has lost its shine a bit now and can not be considered the best investment you can make … Still a small part can be in a portfolio, but not more than 5%.
#7. Debt Mutual Funds: People can invest in these debt funds also if their investment horizon is less than 1 yrs (invest for short term goals).
#8. Insurance: Any one who has still not taken insurance and still finds that he/she needs to take it .. please take is ASAP. There should not be any delay in taking Life Insurance ever.
Some Notes on Inflation:
Inflation may go down below 0% in 2009, because of speedy fall in commodity and crude prices.
India may see some effect of job losses and slow down in 2009 … Corporate results are expected to be devastating in the first and second quarters of 2009 at least … But still, India is among the top growing economies in the world. So we must not concentrate on the short term. India’s future is Great and unquestionable.
Summary: 2009 will be a good year, it is an excellent year and we will not do mistakes if we have done in 2008 and before. we will learn more and use our money in a better way from now onwards.
Let me take one by one each line and do some analysis and raise some questions.
A)Death Benefit:
On death during the first policy year: Basic Sum Assured with Guaranteed Addition.
On death during the policy term after the first policy year, excluding last policy year: 1/3rd of Basic Sum Assured with Guaranteed Addition.
On death during last policy year: 1/3rd of Basic Sum Assured with Guaranteed Addition along with loyalty addition, if any
Some points here to consider:- Your risk cover will be 6 times your investment and just 2 times for the rest of the duration + some loyalty addition if any. So, in a nutshell, it as good as saying your Cover is just 2 times your premium …
– What does it mean? you will get double our initial investments if you die after the first year.
This is the case when you die …
B)Maturity Benefit:
On maturity, the Maturity Sum Assured along with Guaranteed Addition and Loyalty Addition, if any, shall be payable.
Maturity Sum Assured shall be 1/6th of Basic Sum Assured.
– Means, if your premium is Rs 1,00,000, then Basic Sum assured is Rs 6,00,000 and hence, Maturity Sum Assured is Rs 1,00,000
C)Guaranteed Addition:
The policy provides for Guaranteed Addition at the following rates:
Rs. 100 per thousand Maturity Sum Assured per year for a policy of 10 years term.
Rs. 90 per thousand Maturity Sum Assured per year for a policy of 5 years term.
– Means, if your premium is 1,00,000, then your Guaranteed Addition is Rs 10000 (10 yrs) … Means, You will get Rs 1,00,000 as Guaranteed Addition in 10 yrs .. and along with your original capital, you will get back Rs 2,00,000 back after 10 yrs.
D)Loyalty Addition: Depending upon the Corporation’s experience the policy will be eligible for Loyalty Addition on death during the last policy year or on the Life Assured surviving the stipulated date of maturity at such rate and on such terms as may be declared by the Corporation
This may or may not be there.
Now, let’s take a real like example.
Ajay takes a 6 lacs policy over a 10-year term.
Jeevan Aastha Premium = 96,960
The amount he would get if he dies in the first year: 6,00,000
Amount on Maturity : 97000 + (10*10000) = 197000 (loyalty bonus is not assured , so not adding it)
from what angle do you think this policy makes sense. You are maximum doubling your money in 10 yrs and nothing else. And the best time to die after taking the policy is the first year itself .. then you can get a little benefit (but still at a big cost).
I don’t understand why people complicate things .. LIC plans to collect Rs 25,000 Crores from this policy, and I am sure they will succeed. Because there are many people in our country, who don’t understand the effects of Inflation, compounding and get confused with all those confusing statements.
Now if you are a regular reader of this blog .. then you should be able to utilize Rs 97,000 to generate better returns than Jeevan Astha.
Let us do this …
1. Insurance for the cover of 6 lacs, not just for the first year but for all 10 years .. Simple: Take a term Insurance of Rs 6 lacs for 10 yrs, it’s around Rs 9840 (single premium, SBI life insurance for a 26 yr old ) …
2. After this, you are left with around 88,000, which you should invest in Equity Diversified mutual funds either one time or through SIP for 10 yrs … Even if we take a 10% return. It would be 2,28,000.
When it comes to Investing, just Keep it Simple, Stupid (K.I.S.S) … 🙂 UPDATE (28 AN 2009 ): Shyam Pattabi (writes for HINDU) also shares his similar thoughts on this product at http://www.shyamscolumn.com/2009/01/guaranteed-return-schemeanyone.html ( i am glad I made correct analysis) Update (Jan 19, 2008): On NDTV Profit, Monika Halan has given comments that “Jeevan Astha” should be the last product you should look for and only if you have cash to put nowhere, They have given “Don’t Buy” rating to this product and they also said that this product has lots of hype got created. Monika Halan is Editor of “Outlook Money” and One of the most mature and best personal Finance advisor I can think of.
Disclaimer: The above analysis is based on my study and should not be taken as investment advice or discouragement from advice, use your own analysis to take your decisions. I will not be responsible for your investment decisions.
During the last 5-6 months GILT funds have given returns like Equity funds … Something around 20-40% in last 5-6 months … And they are almost safe on downside … Lets see more on this Read : 5 mistakes of my first trade
What are GILT Funds ?
A mutual fund that invests in several different types of medium and long-term government securities in addition to top quality corporate debt.
To have a look at different GILT Funds see : http://www.moneycontrol.com/india/mutualfunds/gainerloser/17/15/snapshot/dlong/ab Risks factors
Gilt funds have different kind of risks associated with it .. Once of them is interest rate risk … There returns are inversely proportional to the interest rates and the reason for the exploding returns given by most of these GILT funds or other Debt funds are the result of “interest risk drop in last 6 months because of the measures taken by RBI” .
However, there are some negatives too to these funds. Bond yields carry a higher credit risk than G-Secs and in bad times ratings can go for a toss. Some retail investors don’t understand ratings and are also not aware of which corporate debt these investments are made in to. Read about “Why you need Contingency Funds”
In the link http://www.moneycontrol.com/india/mutualfunds/gainerloser/18/03/snapshot/op1/ab/option/dlong/sort/yr1 , If you see the 6 months returns and 1 year returns , they are 41.2% and 41.8% , Think about what was the return during the 6 months period before 6 months (Dec 07 – May 08) .. The last 6 months have been exceptional for our Economy because of drastic decrease in interest rates in short period of time . This happens rarely .
To get a good idea of actual performance of these funds , you should see long term returns like 5 yrs returns or Since Inception returns .
Now if you see http://www.moneycontrol.com/india/mutualfunds/gainerloser/18/09/snapshot/op1/an/option/dlong/sort/yr1for annualized returns , No fund has crossed 12% returns CAGR , and most of the top funds are in range of 7-8% Except the out performers with 10.3 and 12.4% .
http://www.valueresearchonline.com/funds/newsnapshot.asp?schemecode=1921 Shows the snap shot of a fund from the list .. you can clearly see that the risk Grade is HIGH for this fund , because of the risk associated with interest rates . (try to click on Portfolio part and see risk return chart) .
What you should do now ? Should you invest in Them ?
Don’t get fooled by the past returns for these Funds , because now there is no charm left in these funds now . They were excellent funds before 6 months and those who anticipated the interest rates drop made most of it . So next time where you anticipate there is going to be fall in interest rates , then you can consider these funds for your DEBT part of portfolio … These are still good funds if you don’t believe in Equity investment in these troubled times, but from my side “Equity Investments are best as of now ” considering your time frame is 4+ years .
Summary
GILT funds are mainly DEBT products , the normal long term returns expected should not be more than 8-10% on average … But still short term opportunities exists when drop in interest rates are expected … To read more articles : Go to the blog directory (Click Here)
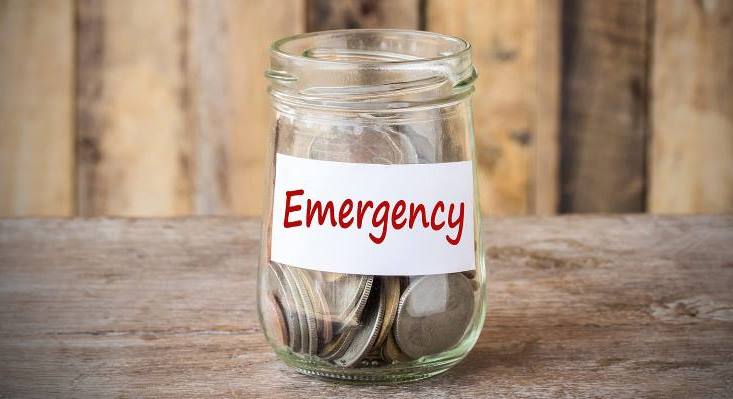
Planning your financial life does not mean planning for your long term financial needs only, It will be incomplete unless you keep an emergency fund for the unexpected emergency situations.
In this article i will tell you why it is important to keep emergency fund and how much of this fund you should keep aside.
What is Emergency fund?
Emergency fund is the money that you should keep aside, so that you can use it in case you meet up with some sudden financial surprises, for example –
Emergency funds are not to satisfy the daily expenses and basic needs, it is a support that you will have when you really need it in your hard time.
Why is is essential to have an emergency fund?
Having an emergency corpus must be the priority for everyone while planning for a great financial life. Let’s see some of the impacts of having emergency fund on your personal and financial life.
1. Helps you to keep your stress level low
When your know that you have an emergency fund, you can live a stress-free and relaxed life. Because you know that you have a backup plan and so if any emergency pop-ups you are already ready to face it.
2. No need to take an emergency loan
Taking a loan or asking for money in your hard time can sometime hurts your pride. Having an Emergency fund will be helpful not only to solve the problem but it also protects your self-esteem.
3. Don’t have to redeem from your future savings
Your savings are related to some very important future goals of yours. Contingency fund will help you to protect those dreams of yours by satisfying your today’s emergency need.
4. No need to cut your essential expenses –
It happens with most of the people, they have to sacrifice their expenses though they are important, to collect money for their unplanned or emergency expenses. Having an emergency will be a helpful hand in those difficult times of yours.
Why it makes sense to have an Emergency fund?
With the global slowdown, there are many cases of unexpected job losses in the field of Finance, IT, Manufacturing and many others. You never know when you will be without job.
Lets take two scenario when you loose your job and you either had Contingency funds and you did not, Let us see what happens in these two cases.
Case 1: You do not have contingency Funds: Put yourself in this Situation, Close your eyes and try to think about this situation, How do you feel?
Your Family depends on you, all your family expenses are met with you salary, now you loose your job!! What if you don’t find another job soon? In this situation you have a heavy pressure on you to anyhow find a new job as soon as possible, You need a JOB !! and not a “good” or “appropriate” or “Dream” JOB.
If you find a job, but you don’t like it or wanted to do it .. still you will have to take it because of the pressure of “finding a JOB because of others depending on you” …
You compromise on Salary, Company and your wishes. Why does this happen? This happens because you cant wait, because you don’t have the to survive of another 1-2-3 months. You know that you can wait a little more and find a good job suitable for you, but you cant wait.
Case 2: You have Sufficient Contingency Funds: This case is just the opposite of what we discussed above. When you have sufficient CF, you have a relief in mind that you have sufficient time to find a good job without compromising your family needs.
You don’t feel the pressure to get the job ASAP. Though you have to find a good job soon, its not necessary that you take any shitty job which comes your way …
See this Video too …
How to start saving for Emergency fund?
1. Pre-decide your monthly expenses –
Plan your monthly expenses. Try to control your expenses as much as possible, so that you can save money to invest in your emergency fund. Today’s unnecessary expenses can have a bad impact on your savings for your contingency fund.
2. Set an auto deduction towards emergency fund –
When you set an auto-deduction for your emergency fund at the start of the month, you will not have any regret at the end of the month for not saving anything for your unexpected emergencies.
3. Don’t touch the emergency fund for quick needs or smaller crisis –
Lot of people do this mistake, they use their emergency corpus for the some very small emergencies which they can handle with their routine expenses also. You should criticize the situation and
4. Save for emergency before investing in long term goals –
You long term investments are related to your specific goals. So it is obvious that you have as emotional attachment with those investment and you don’t want to touch that money for any other purpose. If you have an emergency fund, then you don’t need to use the money you have invested for your future dreams.
Besides, some long term investment have lock-in period, so if you want to redeem your money before completing the maturity time period, you will have to pay some penalty charge.
Where to have Contingency funds?
As per the name, it can be seen that this amount is required at the time of unforeseen situation which can happen anytime,so it must be parked at some liquid avenue like Bank account or Liquid funds.
If you are keeping 4 months of funds as CF, then you can keep 1 month money in Cash and rest 3 months money in Liquid funds.
Summary: Contingency Funds are the part of Risk management. And risk management is something no one should avoid. People realize its importance only when they plan for it and get trapped in a situation which demands Contingency funds. ..
So now its your turn. Plan for it, be ready for unplanned emergency, and secure your future.
What do you feel after reading this article? Do you agree with this?
do let us know what do you think about the concept of emergency fund and also your view on this article in our comment section.
This is a time when long term investing should be done. If you have spare cash for long term, Equity is for you. But how do you do it? How do you choose them? What are the important things you should look at while buying shares for long term?
There are some key things we will have a look at today, these are the key ratios discussed in book Profitable Investment in Shares, by S.S Grewal and Navjot Grewal.
But, before reading them understand that they are ratios which good indication of share prospects and are not guarantee about share price rise in long term, Share markets always run on Emotions and perspective which can change anytime…
Also periodic review is necessary, just buying today and looking after 10 years is not the idea… Buying is always the first step, Periodic review is the next.
8 Ratios to look before buying a share
1. Ploughback and reserves
After deduction of all expenses, including taxes, the net profits of a company are split into two parts — dividends and ploughback.
Dividend is that portion of a company’s profits which is distributed to its shareholders, whereas ploughback is the portion that the company retains and gets added to its reserves.
The figures for ploughback and reserves of any company can be obtained by a cursory glance at its balance sheet and profit and loss account.
Ploughback is important because it not only increases the reserves of a company but also provides the company with funds required for its growth and expansion. All growth companies maintain a high level of ploughback. So if you are looking for a growth company to invest in, you should examine its ploughback figures.
Companies that have no intention of expanding are unlikely to plough back a large portion of their profits.
Reserves constitute the accumulated retained profits of a company. It is important to compare the size of a company’s reserves with the size of its equity capital. This will indicate whether the company is in a position to issue bonus shares.
As a rule-of-thumb, a company whose reserves are double that of its equity capital should be in a position to make a liberal bonus issue.
Retained profits also belong to the shareholders. This is why reserves are often referred to as shareholders’ funds. Therefore, any addition to the reserves of a company will normally lead to a corresponding an increase in the price of your shares.
The higher the reserves, the greater will be the value of your shareholding. Retained profits (ploughback) may not come to you in the form of cash, but they benefit you by pushing up the price of your shares.
2. Book value per share
You will come across this term very often in investment discussions. Book value per share indicates what each share of a company is worth according to the company’s books of accounts.
The company’s books of account maintain a record of what the company owns (assets), and what it owes to its creditors (liabilities). If you subtract the total liabilities of a company from its total assets, then what is left belongs to the shareholders, called the shareholders’ funds.
If you divide shareholders’ funds by the total number of equity shares issued by the company, the figure that you get will be the book value per share.
Book Value per share = Shareholders’ funds / Total number of equity shares issued
The figure for shareholders’ funds can also be obtained by adding the equity capital and reserves of the company.
Book value is a historical record based on the original prices at which assets of the company were originally purchased. It doesn’t reflect the current market value of the company’s assets.
Therefore, book value per share has limited usage as a tool for evaluating the market value or price of a company’s shares. It can, at best, give you a rough idea of what a company’s shares should at least be worth.
The market prices of shares are generally much higher than what their book values indicate. Therefore, if you come across a share whose market price is around its book value, the chances are that it is under-priced. This is one way in which the book value per share ratio can prove useful to you while assessing whether a particular share is over- or under-priced.
3. Earnings per share (EPS)
EPS is a well-known and widely used investment ratio. It is calculated as:
Earnings Per Share (EPS) = Profit After Tax / Total number of equity shares issued
This ratio gives the earnings of a company on a per share basis. In order to get a clear idea of what this ratio signifies, let us assume that you possess 100 shares with a face value of Rs.10 each in XYZ Ltd. Suppose the earnings per share of XYZ Ltd. is Rs.6 per share and the dividend declared by it is 20 per cent, or Rs 2 per share.
This means that each share of XYZ Ltd. earns Rs 6 every year, even though you receive only Rs 2 out of it as dividend.
The remaining amount, Rs 4 per share, constitutes the ploughback or retained earnings. If you had bought these shares at par, it would mean a 60 per cent return on your investment, out of which you would receive 20 per cent as dividend and 40 per cent would be the ploughback.
This ploughback of 40 per cent would benefit you by pushing up the market price of your shares. Ideally speaking, your shares should appreciate by 40 per cent from Rs 10 to Rs 14 per share.
This illustration serves to drive home a basic investment lesson. You should evaluate your investment returns not on the basis of the dividend you receive, but on the basis of the earnings per share. Earnings per share is the true indicator of the returns on your share investments.
Suppose you had bought shares in XYZ Ltd at double their face value, i.e. at Rs 20 per share. Then an EPS of Rs 6 per share would mean a 30 per cent return on your investment, of which 10 per cent (Rs 2 per share) is dividend and 20 per cent (Rs 4 per share), the ploughback.
Under ideal conditions, ploughback should push up the price of your shares by 20 per cent, i.e. from Rs 20 to 24 per share. Therefore, irrespective of what price you buy a particular company’s shares at its EPS will provide you with an invaluable tool for calculating the returns on your investment.
4. Price earnings ratio (P/E)
The price earnings ratio (P/E) expresses the relationship between the market price of a company’s share and its earnings per share:
Price/Earnings Ratio (P/E) = Price of the share / Earnings per share
This ratio indicates the extent to which earnings of a share are covered by its price. If P/E is 5, it means that the price of a share is 5 times its earnings. In other words, the company’s EPS remaining constant, it will take you approximately five years through dividends plus capital appreciation to recover the cost of buying the share. The lower the P/E, lesser the time it will take for you to recover your investment.
P/E ratio is a reflection of the market’s opinion of the earnings capacity and future business prospects of a company. Companies which enjoy the confidence of investors and have a higher market standing usually command high P/E ratios.
For example, blue chip companies often have P/E ratios that are as high as 20 to 60. However, most other companies in India have P/E ratios ranging between 5 and 20.
On the face of it, it would seem that companies with low P/E ratios would offer the most attractive investment opportunities. This is not always true. Companies with high current earnings but dim future prospects often have low P/E ratios.
Obviously such companies are not good investments, notwithstanding their P/E ratios. As an investor your primary concern is with the future prospects of a company and not so much with its present performance. This is the main reason why companies with low current earnings but bright future prospects usually command high P/E ratios.
To a great extent, the present price of a share, discounts, i.e. anticipates its future earnings.
All this may seem very perplexing to you because it leaves the basic question unanswered: How does one use the P/E ratio for making sound investment decisions?
The answer lies in utilizing the P/E ratio in conjunction with your assessment of the future earnings and growth prospects of a company. You have to judge the extent to which its P/E ratio reflects the company’s future prospects.
If it is low compared to the future prospects of a company, then the company’s shares are good for investment. Therefore, even if you come across a company with a high P/E ratio of 25 or 30 doesn’t summarily reject it because even this level of P/E ratio may actually be low if the company is poised for meteoric future growth.
On the other hand, a low P/E ratio of 4 or 5 may actually be high if your assessment of the company’s future indicates sharply declining sales and large losses.
5. Dividend and yield
There are many investors who buy shares with the objective of earning a regular income from their investment. Their primary concern is with the amount that a company gives as dividends — capital appreciation being only a secondary consideration. For such investors, dividends obviously play a crucial role in their investment calculations.
It is illogical to draw a distinction between capital appreciation and dividends. Money is money — it doesn’t really matter whether it comes from capital appreciation or from dividends.
A wise investor is primarily concerned with the total returns on his investment — he doesn’t really care whether these returns come from capital appreciation or dividends, or through varying combinations of both. In fact, investors in high tax brackets prefer to get most of their returns through long-term capital appreciation because of tax considerations.
Companies that give high dividends not only have a poor growth record but often also poor future growth prospects. If a company distributes the bulk of its earnings in the form of dividends, there will not be enough ploughback for financing future growth.
On the other hand, high growth companies generally have a poor dividend record. This is because such companies use only a relatively small proportion of their earnings to pay dividends. In the long run, however, high growth companies not only offer steep capital appreciation but also end up paying higher dividends.
On the whole, therefore, you are likely to get much higher total returns on your investment if you invest for capital appreciation rather than for dividends.
Watch this video to know more detailed information about dividend and yield :
In short, it all boils down to whether you are prepared to sacrifice a part of your immediate dividend income in the expectation of greater capital appreciation and higher dividends in the years to come and the whole issue is basically a trade-off between capital appreciation and income.
Investors are not really interested in dividends but in the relationship that dividends bear to the market price of the company’s shares. This relationship is best expressed by the ratio called yield or dividend yield:
Yield = (Dividend per share / market price per share) x 100
Yield indicates the percentage of return that you can expect by way of dividends on your investment made at the prevailing market price. The concept of yield is best clarified by the following illustration.
Let us suppose you have invested Rs 2,000 in buying 100 shares of XYZ Ltd at Rs 20 per share with a face value of Rs 10 each.
If XYZ announces a dividend of 20 per cent (Rs.2 per share), then you stand to get a total dividend of Rs 200. Since you bought these shares at Rs 20 per share, the yield on your investment is 10 per cent (Yield = 2/20 x 100). Thus, while the dividend was 20 per cent; but your yield is actually 10 per cent.
The concept of yield is of far greater practical utility than dividends. It gives you an idea of what you are earning through dividends on the current market price of your shares.
Average yield figures in India usually vary around 2 per cent of the market value of the shares. If you have a share portfolio consisting of shares belonging to a large number of both high-growth and high-dividend companies, then on an average your dividend in-come is likely to be around 2 per cent of the total market value of your portfolio.
6. Return on Capital Employed (ROCE), and
7. Return on Net Worth (RONW)
While analyzing a company, the most important thing you would like to know is whether the company is efficiently using the capital (shareholders’ funds plus borrowed funds) entrusted to it.
While valuing the efficiency and worth of companies, we need to know the return that a company is able to earn on its capital, namely its equity plus debt. A company that earns a higher return on the capital it employs is more valuable than one which earns a lower return on its capital. The tools for measuring these returns are:
1. Return on Capital Employed (ROCE), and
2. Return on Net Worth (RONW).
Return on Capital Employed and Return on Net Worth (shareholders’ funds) are valuable financial ratios for evaluating a company’s efficiency and the quality of its management. The figures for these ratios are commonly available in business magazines, annual reports and economic newspapers and financial Web sites.
Return on capital employed
Return on capital employed (ROCE) is best defined as operating profit divided by capital employed (net worth plus debt).
The figure for operating profit is arrived at after adding back taxes paid, depreciation, extraordinary one-time expenses, and deducting extraordinary one-time income and other income (income not earned through mainline operations), to the net profit figure.
The operating profit of a company is a better indicator of the profits earned by it than is the net profit.
ROCE thus reflects the overall earnings performance and operational efficiency of a company’s business. It is an important basic ratio that permits an investor to make inter-company comparisons.
Return on net worth
Return on net worth (RONW) is defined as net profit divided by net worth. It is a basic ratio that tells a shareholder what he is getting out of his investment in the company.
ROCE is a better measure to get an idea of the overall profitability of the company’s operations, while RONW is a better measure for judging the returns that a shareholder gets on his investment.
The use of both these ratios will give you a broad picture of a company’s efficiency, financial viability and its ability to earn returns on shareholders’ funds and capital employed.
8. PEG ratio
PEG is an important and widely used ratio for forming an estimate of the intrinsic value of a share. It tells you whether the share that you are interested in buying or selling is under-priced, fully priced or over-priced.
For this you need to link the P/E ratio discussed earlier to the future growth rate of the company. This is based on the assumption that the higher the expected growth rate of the company, the higher will be the P/E ratio that the company’s share commands in the market.
The reverse is equally true. The P/E ratio cannot be viewed in isolation. It has to be viewed in the context of the company’s future growth rate. The PEG is calculated by dividing the P/E by the forecasted growth rate in the EPS (earnings per share) of the company.
As a broad rule of the thumb, a PEG value below 0.5 indicates a very attractive buying opportunity, whereas a selling opportunity emerges when the PEG crosses 1.5, or even 2 for that matter.
The catch here is to accurately calculate the future growth rate of earnings (EPS) of the company. Wide and intensive reading of investment and business news and analysis, combined with experience will certainly help you to make more accurate forecasts of company earnings.
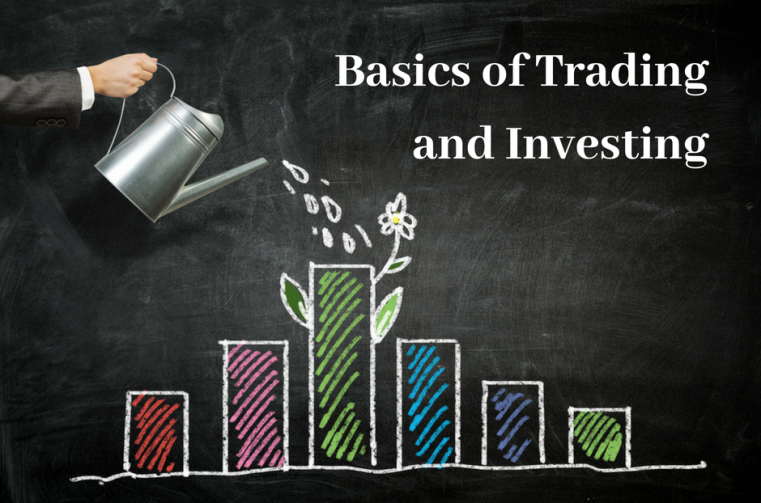
Trading and investing are two different things which confuses lot of beginner investors. In this article I’m going to tell you what is trading and investing and how they are different from each other.
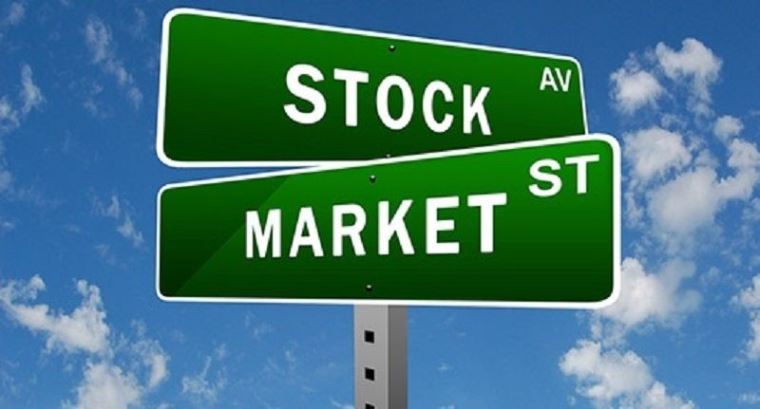
What is an Index?
NIFTY and SENSEX are the Index, they are the indicator of how Markets are performing. An Index is created for measuring a particular section of stocks. When the Index goes up or down, they represent the group of Stocks they comprise of.
So if an Index is up you can say with high probability that most of the stocks under them have done well.
What is Nifty and Sensex?
There are many Stock Exchanges in INDIA, BSE (Bombay Stock Exchange) and NSE (National Stock Exchange) are most famous and biggest of all and with maximum business happening there .
Nifty : Nifty is the Index of NSE. Nifty has 50 biggest companies of India representing the companies from almost all of the sectors, Each stock has there own weightages. Like Reliance, Infosys have High Weightage and Ranbaxy has less.
Sensex : Sensex is a Index of BSE, It is comprised of 30 shares.
What are different Indices on Exchanges?
There are different kind of Indices on Stock Exchanges like for NIFTY.
NIFTY : Basket of all the sectors, Represents all the whole Economy CNX IT : For IT stocks CNX 100 : Top 100 Stocks CNX MIDCAP : For Midcap Stocks BANK NIFTY : For Banks
Each Index represents a sector or a group, if you track a Index you can understand how the sector is performing overall.
What is difference between a Trader and Investor?
Trader : A Trader is a person who tries to earn profit from small movements in price, there time horizon is very small like 1 day or a week or some weeks. For example, A trader will buy something @100 and will sell it at 105 and make a profit of 5. He will try to take advantage of volatility.
His main tools will be Charts, News, sector outlook for short term etc. He will not concentrate much on Company fundamentals, Long term sector outlook.
Investor : A Investor is someone who tries to invest money for long term. Long term can be anything from 1 year to 10-15-20 years.
Investor is more concerned about the fundamentals for the companies, its growth and factors like those which are going to drive the share price in long term not short term … Investor is not concerned about the short term volatility. There focus is long term.
How to Begin Trading?
Trading is one of the toughest things to master. Its a better idea to first learn and read about Trading for some months, Watch the markets for some months and try to paper-trade first. paper trade means just trading on paper and seeing how you perform.
Read about Technical Analysis also. Try to gather more and more info on Trading. Read good Books and Learn as much as you can.
Knowledge and your intelligence has very less contribution in your success as Trader. The main things are Money Management, Discipline, Control over GREED And FEAR, and Risk Management.
Once you are very confident you can start, Start with very small Cash and take big bets only when you have made some progress to cheer about.
Have a plan and targets for your Trading. Take Trading seriously as your business and not as hobby, else with high probability you will Fail.
Watch this video to learn about stock trading at beginners level:
How to Begin Investing?
Read How to analyse stocks and Read books. Have a long term horizon and don’t be afraid of your share coming down …
Should you be a trader or an Investor or nothing?
It depends on your personality, the time you want to give in this and your goals. If you find fun with dealing in markets in short term basis, Be a trader.
If you can devote time to markets in daily or weekly basis, then you can be an Investor.
If you are not interested in Either, just don’t be anything .. Do what you are doing right now 🙂
It was a fast written post, I hope thing are clear.