 Jagoinvestor
 April 2, 2009
How to use Support and Resistance to Buy or Sell Stocks
This is Part 2 of the How to become a better than average Investor series, see Part 1
In the last post we discussed the importance of Fundamental and Technical Analysis. Now we will see one of the most simple, easy and powerful thing called Support and Resistance.
This is for people who have no idea about what is it and have at most heard about it.
Let us see both of them one by one.
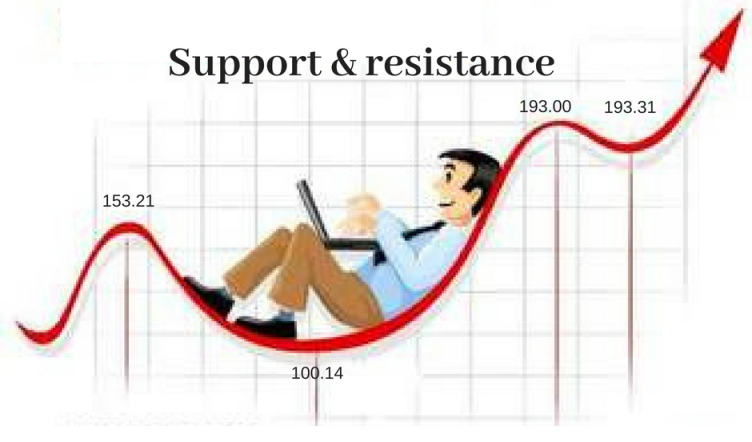
Support :
Support for a price is a price area where there are lots of buyers ready to buy the stocks rather than sellers. At that price point, the general perception is that its a good buy, and lots of buyers come to buy it. Hence buyers outnumber sellers and there is a higher possibility that prices will bounce back from that point . This is a point where Buying has less risk.
In other words, at support levels demand is thought to be strong enough to prevent the price from declining further. Please understand that Support point is not a place from where it will for sure bounce back, Its only the higher probability that it will bounce back.
Also understand that its not exactly a fixed price which should be considered as Support, generally its a range like 98-100 or 560-570 ..
Which point is Support point : Every Low made by the price can be considered as Support Area.
Let see Example :
Support Example 1 : Below chart is for Jaiprakash Associates (click to enlarge), It made a low of Rs.53 (closing price) on 27th Oct 2008 and then bounced up from there.
Now Rs.53 is the support point, Prices went up from that point and after reaching Rs.90, it again started heading down, You can clearly see in charts that it reached Rs.53 levels, but could not break down from that point and again bounced back from there.
It was a very good “BUY” around Rs.53. Understand that buying around Rs.53, is only a less-risky trade, not a “no-risk” trade. Prices can break down from there also.

Support Example 2 :
Below is a chart of RPL. Here you can see that prices made lows of Rs 70 around Dec 1, 08. That became a support point, and then prices reached thought levels around first week of Mar 09, It bounces back from that point, It was a less risk trade around Rs.70.

Resistance : Resistance is just opposite of Support, At this price levels there are more sellers than buyers and with high probability prices reverses from this point. At this point there are enough sellers in the market to prevent it from rising further.
Resistance point is the High made by a price. All the high’s will act as some kind of resistance points.
Lets see examples :
Resistance Example 1 :
Below is Reliance Charts, You can see that reliance made a high of Rs.1400 around Dec 2008, After that you can see how it reversed from that point 2 times in Jan and Feb 2009. It was a wise decision to sell at those points.

You can also find many examples like this if you investigate yourself. Try to see other charts if you are interested, you can look at charts at ichart.in or https://www.bazaartrend.com/index.php , find yourself)
Important Note : When prices are near Support or Resistance levels, you should be more alert. It does not mean that you just jump onto market and buy or sell, Be patient to see the actual price reversal, Though you will loose some part , that would be a better trade.
Also there are several other factors which should be considered, but for now lets not touch upon them. lets keep it simple for readers.
Lets also look at some important points
Break Down :
Always remember that when prices don’t hold support and break them and fall further, it tells that buyers are not strong enough and Sellers have taken over them and prices will make new lows, When support is broken, Sell further.
Example : Below is the chart of RPL, which shows how it broke down its support point and then made further lows.

Break Out :
When prices don’t hold resistance points and break them on upside, prices then indicate that they are going to make new highs. Better to buy at that point.
I have put a post on my analysis blog for Reliance Break out : please see it :
https://manishanalysis.blogspot.com/2009/04/reliance-break-out-target-1800.html
Some Other points to remember :
1. Support and Resistance points are places where you should be more alert and look for other signals to buy or Sell, just don’t buy because prices have reached near support, buy it when it starts rising and there are positive signals.
2. Support once broken becomes Resistance for next time, and Resistance once broken becomes Support point for next time, use this knowledge. See : https://candlestickmania.blogspot.com/2008/07/resistance-becomes-support.html
3. Many times there are false breakout and breakdown, So it will many times happen that you get out at important levels and miss the large movement, that’s fine, you can always enter after getting out.
4. This is most important point, Everything I talked about in this article can increase your chances of making more money in trading, but remember that you are dealing in Markets, and if you don’t control your GREED and emotions, your failure is guaranteed.
Use strict Stop losses and use Money management techniques (it means not putting all your money at once, if you have 10 lacs, put only 1 lac, don’t be greedy enough, else someday you markets will punish you badly, then no Technical analysis or any thing will help. have good amount of cash with you always ).
All technical Analysis and knowledge are of no help if a person cant control his greed and emotions in Market. TA and your knowledge will contribute not more than 20% of your success in long run.
This was end of Part 2 of this series, In next port (Part 3) we will see how to find support and resistance levels using TRENDLINES. wait for it.
Comments please, Its sometimes disheartening to see no comments after I put up a post after some hard work. I don’t want “good post or Great Article kind of comments, but at least share what you have learned and ask questions, make it little interactive please.
Question for you all :
Question 1 : Do you think this support or resistance thing works , or can you add anything else how to buy or sell and what things to observe at support and resistance levels , which can make buying and selling more successful?
Question 2 : What do you think about Chambal Fertilizrs at this point , see the charts at : https://www.bazaartrend.com/index.php?symbolname=CHAMBLFERT (click on the upper left button to make it full screen).
Suggest what should be done at this point of time ?
I came across very nice video, about difference between winning and success, a worth watch. See it below
Note : All the things discussed here are available on net with great detail. learn more of it yourself.

Ufff.. Lot of technical stuff.. Understood the concept but need enough time to understand & apply it clearly and then can jump to direct equity.. After all direct equity is not everyone’s cup of tea 🙂 …
Yes, and more than that technical analysis is not everyone cup of tea .. try learning it with 5k 🙂
Hi Manish,
Do you know any site through which I can set a trigger for a share so that I get SMS and email alert whenever price of a share increases or decreases beyond a threshold limit?
– Debanjan
Hi Manish,
thank u for showing such a gr8 things…
I want to know that if any share is at support level and moves up and someone is buying the stock then what should be SL for this…………….also for resistance.
Amit Aggarwal
Amit
Support and resistance are points where the events of going up or down is not 50% 50% . Its very skewed to one way . so At support there is much higher chance that it will move up , and very less chance that it will move down . You should never assume that some event will happen with 100% chances
<Manish
thank you very much about this goolden data
i have lot of questions hope to help me
1-can you show use the relations between indecators and commodities or stocks?i want to know there are arelation or what ? how can measure the market?
2-there are two ways to calculate pivot point to catsh resistance and support.
why we caculate 1R 2R AND 3R SAME IN 1S 2S AND 3S? i mean why three excpectations?
what is the different between (Floor Pivot Points & Woodie’s Pivot Points & Camarilla Pivot Points & DeMark’s Pivot Points)
thank you for helping
Tarek
You should be asking it on our forum
Manish
Hi, Can u tell me which software u r using for interactive charts?
Which chart ? Give me the link ?
Manish
Hi, Manish
http://3.bp.blogspot.com/_X_VzTEW-wIQ/SdSlovWS_8I/AAAAAAAABRM/UpQ0qM28Z30/s1600-h/RPL_breakdown.png
This image shows that the following chart opened in a applet window. My doubt is, is that a software or ……
Thats made frmo http://www.bazaartrend.com . You can use it for free online .
Manish
Thank u Manish
Saleem
This is now getting very technical , not for commom people , the most easy SL would be to just use SL 2-3 points below the buy price .. like If you buy at 43 , your SL can be around 40 . Understand that it depends on how much you can risk .
The thumb rule is 2% of your total Equity in Trading …
Other better ways of doing it using ATR . that Average True Range of the stock … You can use 1.5 or 2 times the ATR of the stock … Read your self on this topic .
in short ATR is the average price range of the stock over some time … like if you calculate how much was daily movement (open – close) of stock and it was 2 , 1.5 , 3 , .7 and 2 for previous 5 days , the 5 day ATR is average of all these 5 numbers : 1.84
Now you can use 2 times ATR = 3.78 point below the buy price … the point is that this 3.78 is beyond the average volatility , if prices come down less than 3.5- 4 , its considered nothing but volatility in price movement , but if its crosses its 1,5 or 2 ATR , then its not volatility , its some serious movement worth noting 🙂
Hope you learnt something !! , Read read read !! .. Learn Learn Learn !!
Manish
Manish,
Thanks for the quick response. In case its a false breakout we need to have strict stop loss, right. In this scenario any idea how to calculate the stop loss.
Thanks.
Saleem
Very good . That was perfect analysis .
The other points which confirm the analysis are . If you see the length of the channel (previous Support (33) – Resitance (43)) = 10 points .
Next Target = Reistance + 10 = 43 + 10 = 53 .
So , from this way also we get a target of around 53 .
Well .. dont concentrate a lot on exactly number 53 . The resistance level can be anywhere around 52-54 …
Dont forget that all this analysis is probabilitic , It just has higher chances . So next week it might happen that prices go back in previous channel and we come to know that this was a false breakout , if that happens , it would be a great signal to “SELL” and then we can expect it to go back to 34 levels 🙂
Cheers
Hi Manish,
For the second question, from the charts I can see that the chambal fertilizers has broken out its resistance level 42-43 and is moving towards next resistance level which is around 53. In this volatile Market where there is lot of uncertainty can we go and buy this stock thinking it has broken resistance and it will go to 53 or wait for the next cycle, I mean let it go to 53 and once it come down to 43 then buy it. Since it has just broken the resistance and soon after that before reaching 53 if downtrend starts will it find support at 43. Let me know what you think on this.
Thanks.
Swathi
If you are talking about http://www.bazaartrend.com/index.php?symbolname=CHAMBLFERT
you must be able to see the chart after it gets loaded .. give 10-12 seconds to the page to load it 🙂
Patience 🙂
Manish
I got it ! I was seeing support and resistance as two seperate entities.I need to study much more to understnad these in real time.
And coming to your 2nd question – I can’t see any chart in the link u gave ??!
Swati
lets first look a new example … suppose a stock support is at 100 , the price have come to this point and often revered back to go up again , suppose next time prices reach near 100 and break them and go below it to reach say Rs 60 . Now 100 which was support earliar will now be resistance point .
Reason : Try to imagine a situation when prices were above 100 and coming down near 100 . most of the people know that its a support area , so its a good time to buy , lots of people enter at that level and hold the stock , but when prices go lower than that , they are stuck at that point … All of them are wishing that they recover there cost . So when next time prices go near 100 , there is lot of selling pressure from people who were stuck in the stock .
That the reason why a strong support area will become strong resistance area later .. because more stronger it is , more people will be stuck there .
I hope you understand 🙂
Manish
Hey manish, good post. But I did not understand the below line:
“Support once broken becomes Resistance for next time , and Resistance once broken becomes Support point for next time “
Suppose there is a stock A which has reach a low of Rs 30- this is the support level.Suppose if this broke at sometime and the stock reached a low of Rs 25 then this will be the new support level but why will it be the resistance for next time?
Please explain.
Arun
You are correct when you say , buying and selling like this is more useful for traders, but even investors can use this basic knowledge to buy there stocks for long term , atleast they will know If waiting for some more time before buying or selling can bring them some rewards .
knowledge of support and resistance is very easy and can be used by anyone , So ts worth knowing how a long-medium term investor can use it for there investing .
I am not commenting on your chambal analysis as there are many others to post there commnets 🙂
And i also agree with you that investing is more of art , but when you couple them up with some science like TA , your probability of success increases 🙂
At the end a person has to decide if it works with their personality or not !! .
Manish
Answer to your first question I think this works but its more of an art beyond a certain point. If this analysis is repeatedly done the probability of success improves
Answer to second question
I think CHAMBLFERT has broken its resistance and is now on an upward trend. Its resistance around Rs43 has been broken.Its support initially was around 33.5 when I analyze the lows.
Question for you: Buying and selling like this is more useful for traders. If I want to go long term are there any other specifics I should know?