

What is better? Equity or Equity + Debt In this article I will show you how always maintaining your Asset Allocation with Discipline helps you in long term.
We will see examples of Asset Allocation with Portfolio Rebalancing with Charts and a small Presentation. At the end we will conclude that Having A small part of Debt in your portfolio is better than having no debt.
Note: Make sure you read this article in one go, not in parts.
Data Collection and Making the Case Study
I gathered the NAV of SBI magnum Taxgain ELSS fund (click here to see which is the better fund that SBI Magnum) for last 10 yrs for each quarter. NAV are for 1 Jan 2000, 1 Apr 2000 and so on for each quarter (getting them each one by one from moneycontrol was really time consuming). So we have 38 NAV values from Jan 1 2000 to July 1 2009.
Scenario
- Total Capital Invested : 1,00,000
- Debt Return : 8% per/year , 2% per quarter (for simplicity) .
- Equity Return : Calculated for per quarter (if Nav rose from 10 to 12 , return was 20%) .
Now I am comparing Two cases with and Without Asset Allocation and Portfolio Rebalancing .
Case 1 : Money was Invested One time in Equity and then it was left for Growing.
Case 2 : Money was Invested and Principles of Asset Allocation and Rebalancing was also used.
We are trying to Study which one of Case 1 and Case 2 is better. I did a Small Study and calculated the returns on different values of Asset Allocation like 20:80, 50:50 and 80:20 etc. Here are the findings:
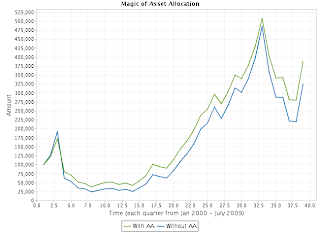
Let us first look at the chart with Asset Allocation 80% Equity and 20% Debt which personally suits me and almost anyone in below 35 yrs age. (click to enlarge)

The Green Line is growth of investments with Asset allocation and Re-balancing (case 2), and Blue line is Growth of investments with no asset allocation (just equity, case 1). See how After 2 quarters, the Green line always was above Blue Line. Also see that final Value of Investments was higher in case 2 than case 1.
Also see, Magic of SIP , why SIP in mutual funds is best for long term.
The final Value of Investment kept increasing when Equity Allocation was raised from 0 to 70-80 and then started reducing when further increased it above 80.
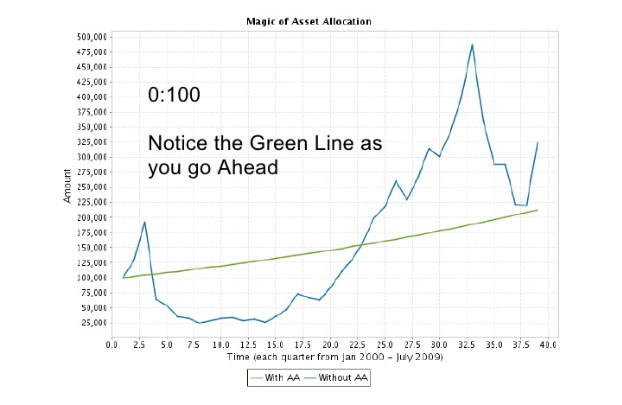
See the Graph Below, this is a small presentation with each slide of separate Equity Allocation starting at 0% in equity and then increase by 10% every time. So first slide is 0% equity 100% debt, second slide is 10% equity and 90% debt and so on, it goes up to 100% equity and 0% debt.
It beautifully demonstrates the shift and change in value of Investment caused by Equity Allocation. To view it in the best way just have a look at each slide in one go and it will appear as a small video ;). Guys I worked hard on this.
Asset Allocation Effect (make fullscreen if you want)

View more documents from manish.pucsd.
In a time span of 38 quarters (10 yrs approx), Case 2 consistently outperformed Case 1 i.e. if you see, in how many quarters Value of Investment was higher in Case 2 compared to Case 1, Case 2 beats case 1.
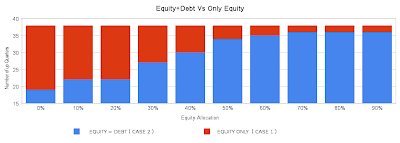
Below is the chart which shows in how many quarters Value of Investment was higher in Case 2 than case 1 i.e. for each quarter the case (case 1 or case 2) which has higher value of investment will get 1 point. You should also look at IV Ratio.
It was found that Case 2 always had higher points than Case 1 and Case 2 points kept increasing with higher Equity Allocation. The minimum Case 2 had was 19 points, when the asset allocation was 0% equity and 100% Debt. See the chart Below
Returns Were going up with higher Equity Allocation (around 70-80) and then fell further.

The final value of Investment was increasing for higher Equity Exposure till it was 80:20, and then it started Decreasing. See the chart below (click to enlarge)

To go deeper, I calculated some other returns.

Case 1 (Only Equity) returned
- 13.2% CAGR in 9.5 yrs, see this video to learn how to calculate CAGR and other important formula’s
- Value of 1,00,000 became 3,24,946 .
Case 2(Asset Allocation) returned
- 13.1 % with 30:70
- 15.11 % with 50:50
- 15.67 with 70:30
In case you are new to Stock Markets, Download this Ebook on “How a Newcomer should Start in Stock Markets”, check out the Download Page for more.
What Does This Teach us
There are some important Learning’s here which we must understand well and have it deep rooted within us for our entire Life. This will help us in long term. Following are the Learning’s:
Learning 1# Equity Returns 12-15% over long term:
We can expect better returns from Equity in Long term, also average return over long term from Equity is around 12-15% as we saw in our case. So don’t expect returns like 30% or 40% every year. Once in a while you can get it but if you try harder and harder for it you tend to take unnecessary risk and hence screw yourself.
So better follow a disciplined approach and peacefully get 12-15% over long term. This does not apply to Traders and whole time participants in Stock Markets. They can/should/deserve to make more than 25-30% a year from stock markets.
Learning 2# Debt is extremely Important!!
Debt is an Important and vital component of Financial planning and your Investments. Love equity, Adore Equity and Worship Equity, but *don’t* forget Debt. Debt has eternal powers!!
Equity Combined with Debt can produce far superior returns over long term. In our examples above the best returns we got were for Equity and Debt ratio of 70-30 or 80-20 range.
Learning 3# Have a long term view to get results:
People who have recently started investing through SIP, ULIP or Direct Stock Investing need to understand that it takes time for the investment to grow!!
If you are doing right things like following specific Asset Allocation, Portfolio Re-balancing, Diversification, Investing with Discipline and control over yourself to avoid making stupid mistakes you need not worry at all. At the end you are the winner for sure. It will take time but things will show up.
You might see some person making 30% this or other year minting money from markets or from other investments and this can make you feel that you are left out but don’t feel bad, what you forget is that the other person is also exposed to extra risk which will kill him someday while you will be safe.
Learning 4# Returns is not Everything in Investments (my Favorite)
This is very important and you need to get this into your head and heart. Just like Money is not everything in life and there are other things like love, good health, Nature etc. etc. The same way in your financial life, you should have peace of mind. For which your investments value variation should not be wild enough to drive you crazy.
You should “aim for” and get “stable and good” returns which meet your financial goals, that’s it. Anything more than that will be a “treat” for you and should come to you without compromising your Needs in Life.
Suppose your money invested gives you return of 30%, -20%, 50%, -40%…. With these kinds of unstable and wild returns what will happen to your state of mind?
It will always be worrying over it and you will make mistakes in your financial decisions.
On the other hand if you get returns like 12%, -5%, 9%, 20%, -10% etc. It will not bother you much because there are no wild swings in your Investments value. At the end both will give you same kind of returns. The average returns would be same but the former case has higher variance of returns which “may be” good for your account, but it’s “not good” for your Mind and soul.
You will also notice in the charts above that with 70:30 equity : debt allocation, in 36 out of 38 quarters, the investments in case 2 were more than investments in case 1 which means that 95% it outperformed.
Learning 5# You should Start Early In Life
Ramit Sethi writes an excellent article on Why NOW is the best time for you to do anything , Be it early Investingg, Travelling, Meeting new people, whatever!! If you start early, you give enough time to your investments to grow and work for you. It also less risky if you start early because then the volatility is erased out in many years.
Partha shares a link for a study done on Similar subject at Accretus Solutions, Looks great link to me :).
** What do you think about This article, please leave your comment and suggest how did you like this article and what are your suggestions on making the investments in a much better way.
With this I will end this article, and dedicate this article to all the readers of this blog. I was working on this article for last 2-3 days, gathering data, doing calculations, creating charts, writing this article etc. etc.
It has come from hard work for some days, but the motivation behind it is my wonderful readers. Believe me or not, The person who has/will learned most from this article is ME, Thanks to you all – Manish
Liked the post, Subscribe here to get posts in email