 Jagoinvestor
 April 9, 2009
How to use Oscillators to BUY an SELL
Hi
This is 4th part of the “How to be a better than average Investor” series of articles. Today’s lesson is on Oscillators .
What are Oscillators :
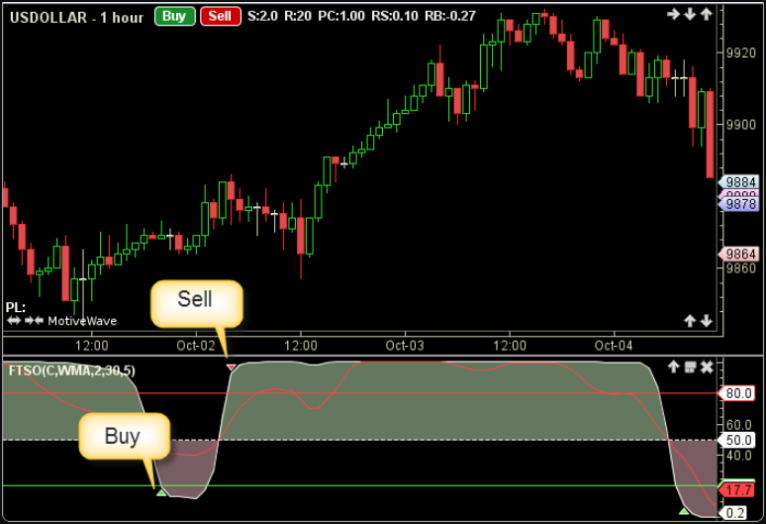
Oscillators are the indicators which move from overbought to oversold area, generally from 0 to 100. when they are nearing 100 it means stocks are overbought and “expected” to go down now. when they are nearing 0, it means, stocks are in oversold area and fresh buying can come and move the stock up.
hey .. wait a min, did you vote on the poll upper right side, I have asked on what all topics do you want me to write. Please select topics from them, so that you also get to read your favorite thing some time 🙂 cheers … go ahead ..
I will discuss just 2 oscillators which Investors can use to make better BUY AND SELL decisions.
Let take a time frame of 6 months and see how indicators gave signals of buy and sell. We will see 2 indicators here RSI and Slow Stocastics (SS) (Read what is RSI and What is Slow Stocastic ).
Rules
When it’s overbought, we SELL the share.
When it’s oversold, we BUY the share.
SS BUY signal = when blue color line crosses down the Red line.
SS SELL signal = when blue color line crosses above the Red line.
RSI BUY signal = when RSI has moved below 30 and starts moving up.
RSI SELL signal = when RSI has moved above 70 and starts falling down.
To make signals more stronger, we will use both the indicators signal and take BUY or SELL only when both shows same kind of signal.
OVERBOUGHT = when RSI and SS both are overbought
OVERSOLD = when RSI and SS both are oversold.
Note
At any point of time, markets may be in any of 3 state.
– Uptrend
– Downtrend
– Side ways Movement
Understand that these signals work best in range bound market, like we had for last 6 months. When market were moving in range of 3100-2600. If markets are in strong Uptrend or Downtrend, these indicators will generate many false signals.
Hence, In different markets we have to use different strategies.
Uptrend Market : IN Uptrend, you should avoid selling the stock, when there is small correction, Indicators can fast move in oversold region, that is the time you should BUY. But not SELL when prices are in over bought market.
Downtrend Market : In Downtrend, you should avoid Buying the stock, only SELL when the indicators are in overbought region .
Sideways Market : In this market, you can buy and sell both.
Lets see some examples for last 6 months. This was a Sideways market (but still downward bias was there, so be careful with BUY, you can take SELL easily).
DLF Chart


ICICI Chart
RELIANCE CAPITAL


Some Important things to NOTE (very important)

Oscillators should not be used in Isolation alone, You should also confirm it with other things like Support and resistance to make your BUY or SELL more stronger.
For example : If prices are near the Overbought, but you see that prices have broken the resistance point, its tells you that you should not BUY. because Oscillators are secondary thing, prices are primary.
Also, If prices are near support and not breaking it, and oscillator are in over sold area, then its safe to BUY. Never rely just on Oscillators, they are only helping tools used with other signals.
Lets see one Chart of JaiAss for testing what you have learnt.
Questions for you
– Tell me where are the buying and selling opportunities.
– Tell me where you should have avoided the signals.
– What according to you can help along with these oscillators.
– Can you come up with some other oscillator of your own which can measure some important thing )
JAIPRAKASH ASSOCIATES CHART

ok, So finally we end the 4th part of this series of articles on Technical Analysis. I hope you have learnt some things from me.
Earlier Posts
Part 1: What is Fundamental and Technical Analysis and which should be used When
Part 2 : How to use Support and Resistance to BUY and SELL ?
Part 3 : How to use Trendlines to find Support and Resistance ?
Understand that we are not learning how to trade, we are learning some trading tools which can be used by long term traders to make better Buy and Sell decisions .
Incase you want to trade stocks/futures/options just after learning from these 4 articles, I must tell you have you have not learned even 1% required for trading. 99% is still there to be learned and over all knowledge of markets, technical analysis blah blah is just 10%. 90% is Psychology, your attitude and your Discipline.
Trading is risky and not easy to do for long term.
Leave you comments / thoughts / suggestions / and answers to test question.
hey .. wait a min, did you vote on the poll upper right side, I have asked on what all topics do you want me to write. Please select topics from them, so that you also get to read your favorite thing some time 🙂 cheers …

Thanks. That will help
Arun
I would not be talking much on indicators and tools one can use in Trading . One can do it yourself ..
The reason I will not cover them has following reasons .
– Its available all over net and in books , one just needs to go and read them .
– They are not too much important for making money in trading , its other things , wait for my next article .
– This blog does not concentrate much on trading and markets overall , this is a personal finance blog , which helps and average investor .
You can do your analysis on number of places.
Some are :
– icharts.in
– bazaartrend.com
– Yahoo charts (http://in.finance.yahoo.com/q/ta?s=%5ENSEI&t=5d&l=on&z=l&q=b&p=e50,e200&a=v,m26-12-9,ss,r14&c=)
Thanks
Manish
Hi Manish,
Very good charts with lot of trend analysis (user driven) are also available at : http://www.moneycontrol.com ; The chart details is little bit hidden feature. Here is the details: One has to search for company in the search field at the top, get the company name, and observe that the chart is displayed. Now click on the 6 month or 3 month button, from which you can see detailed bigger chart in which menu options are available to see trend analysis and other statistical details.
Debarajan
Thanks for your suggestions ,
Manish
Thanks Manish. I see your comments which you had put in for Uma’s response.
The many more things apart from this which you mention, would you be able to explain.
If you meant, “its a start” but long way to go. Will be working on it 🙂
Are there any websites where I can play around with stock charts just like you created those lines for support and resistance and the charts above where you put in your comments saying BUY and SELL. Please let me know if US stocks specifically and also the Indian stocks.
@Arun
Yeah Arun you got it … there are many more things apart from this , but for now you are doing good .. make sure that this signals must be used with other indicators also .
Manish
Hi Manish
Late this time! My observations
Just below Rs60 there is a BUY (Dec, 08)
Close to Rs 80 there is a sELL (After Mid Dec, 08)
A BUY again around 65 (Late Jan, 09)
A BUY again around 65 at Mar, 09
A SELL just above 80 at March 09, end
@Jagoinvestor
yeah , I hope you didnt find it difficult . TA is very easy thing , the only thing you have to understand is its limitations and when it should be used .
Over-dependence on it can also be a bad thing .
Keep visiting the blog .
Manish
Hi Manish
Interesting post, the way you have explained various Technical Analysis trends using practical example is really good. In fact, TA was so intriguing that people who understand Finance and Stocks, like me, also find it difficult to interpret various TA indicators.
Thanks and Regards
Manish Misra
@subhi , thanks for the comments .. Please keep visiting for more articles 🙂
@Uma
Excellent work , incase you are new .. you did a great job . Almost all are right answers , but there is scope of improvement in one of two … lets see those
You said “Not a BUY around DEC first week at price 60 since RSI was below 20.”
Always remember that prices are the primary parameters , we only use indicators or any other TA tools just to confirm or make or decision better .
RSI was below 20 , that means its that its a oversold conditions … However before seeing the indicator , first look at prices , where are they ?
you will see that prices are near support and started rising up , this alone is a signal for BUY , just for the confirmation you can see RSI and other indicators which were also in oversold condition … which confirms the signal and hence your BUY signal is much stronger .
over and above you did a nice interpretation and you will learn things well after some experience and learning … keep it up
You must always keep in mind that TA is a confirmation tool . There is nothing above prices … If prices are constatnly going up , but indicators do not confirm . that does not mean you dont take the trade … TA is for extra help …
Also , as this was a range bound market between a main bear market … always take SELL signals more seriously and take BUY signals carefully …
Also , dont forget to mention to put SL strictly without discipline … Just to let you know , unless you have disipline in trading , no amount of knowledge can make you earn money over long run …
For other indicators you can learn about MACD , OBV and William %R etc , search the net .. there is plenty of material 🙂
Overall Nice work …
what a nice presentation.
Your statements for FA and TA is very clear and good. Its the PUNCH statement. Thank you.
Sir, first of all I have taken you as my GURU and sincerely want to learn something.As a new entrant in Rpower ipo period I came to market and I lost so much in markets by tips. Now I realised what is market and what is the way to handle. Just started learning. Here are the answers for your test. In the JPchart BUY 1)around oct25th price around 59 because %k crosses , %d and also RSI is rising from 30.
2) Jan last week price around 65
3)Mar first week price was around 70.
SELL when 1) DEC middle when price was around 90.
Not a BUY around DEC first week at price 60 since RSI was below 20.
Not a SELL in FEB middle price around 75, since RSI was around 50 , 55 and not in the overbought region thats is 70 and also the trend was side ways.
Trend lines, support, resistance levels can be added with this.
I see some more oscillators in reference materials, like Price oscillator, volume oscillator and williams oscillators. But please tell one other oscillator if needed from this list.
thanks Rajat
You are correct about the indicators that they remain oversold and overbought a long time in strong Downtrend and uptrend .. So this is what investors should be aware of .. You have to take decision after considering all the factors .
Btw , This article is not mainly for traders , but for investors . who can use these indicators to make there decision better .
Keep visiting the blog … Your comments and participation is appreciated .
Manish
Hi manish,
nice to see ur blog .this is the first time i have visited ur website…your recent article on oscillators is really very good for beginners ..i agree with you that ..these oscillators shldnt be use on a standalone basis .. combination of indicators is always better to have reliable signals .I use stochastics, rsi and MACD for my trading setup …The MACD indicator is the most reliable one among all. The problem with all these indicators is that these remain in oversold zone and overbought zone during bear phase and bull phase respectively ..As u can see on the charts of dlf, icici and JP associate, Stochastic has already given a sell signal on all these counters and this is the time where ur analysis and experience comes into play .. use MACD and look out for divergences, wait for confirmation and then trade. i am also a student of this market and learning like u ..i ll try to visit ur blog regularly and share my views..Even i have my own blog but dnt get time to update regularly .. http://www.rajatbudhiraja.com/