 Jagoinvestor
 April 6, 2009
How to use Trendlines to find Support and Resistance
Hi Readers
This is 3rd part of “How to become Better than average investor” Series. Read
Fundamental and Technical Analysis, What and When ?: Part 1
Using Support and Resistance: Part 2.
Let us today discuss how can we use Trendlines to use Support and resistance levels and make better Entry or Exits.
What is a TrendLine?
A trend line is a straight line that connects two or more price points and then extends into the future to act as a line of support or resistance. In the Uptrend , we join two low prices points and in Downtrend, we join two high prices and extend it further. Next time when prices approach them, it should probably act as a Support or resistance point.
Let us see one example of each of them.
Example of trend line while DOWNTREND

You can see in the chart how Two high prices were joined and the line acted as Strong Resistance in future, 3 times prices touched it and broke down again, These are good price area where either one can go Short (sell), or book their profits. You can see that now prices are again Approaching to this Resistance line, so once prices reach this point, it may provide a good opportunity to sell.
What will happen exactly, better not to predict and let the market decide?
Understand that we are not saying that prices have to necessarily touch the Resistance line and then go back down , the trend line only provides Resistance, it may again go back much before touching it .
Example of trend line UPTREND
Below if the 2 yrs chart of HIND LEVER, Let us try to make a trend line which acts as support.

If you see the chart, I have connected two low prices and extended it in future, you can clearly see how it acted as support area and prices went back up from there, At the end, you can see how prices are again approaching this support area, most probably this will again hold and it should be a good BUY 🙂
Let us see one more example of Trend lines. This example will show us the following things :
– Resistance line using a trend line.
– Breakout
– How Resistance once is broken became Support
– Resistance line using trendline for a shorter time frame.
Let us see a 2 yrs chart of JAIPRAKASH ASSOCIATES

You can see here how I joined two HIGH Points and extended the trendline in the future, and how prices reacted to this Resistance line. Recently Prices broke out of this resistance line and then this same resistance line acted as the Support line and prices bounced back from there.
Also, you can see a small trendline, which was made joining the low points . you can see how prices bounced up as this support line held the prices. So, we have seen some examples of Trend lines and how they can act as Resistance or Support lines (as per situation).
Some of the important points to note are :
– It’s more of an art to making a trendline, it depends on how you make them using HIGH PRICE, CLOSE PRICE, etc.
– You can make Trendline for any time frame.
– It’s not necessary for prices to touch trendlines, you should not expect it.
– It’s a wise decision to BUY OR SELL using trendlines. If the trade goes in your favor, let your profits run, if it fails, cut your losses short and accept it. there is no problem with being wrong . even the best in Industry fail.
– Trendlines will be of no help unless you control your GREED in markets. Don’t put all your money in a single trade. Keep adequate cash for bad times.
– Once trendlines are broken, take it seriously, it has happened for a reason :).
– Make sure that the two points used to make the trendline are not very near, there should be some time gap between them to believe in them.
– More times the trendline is touched by the price stronger it becomes, And stronger is the break out from that trendline.
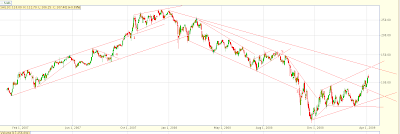
Test for you 🙂
Below is a chart, and I have drawn several trendlines in different time frames, I have marked some points with 1,2,3,4,5, please tell me what are each of them and comments on each point. please do it individually. Let me see who comments correctly on each of them. Also, tell me if there is any other trendline that could have been made, but I have left it?
People who are good with Videos can watch the following videos
Please comment on this article, did you like it? Was it easy to understand? Is it too difficult to use Trendlines ?
Conclusion :
So we end this Article here, We saw the Importance of Support and Resistance and how to make trendlines and use them. In the next part (last part), we will see how we can use some of the Indicators from technical Analysis to make the decision better.
Also, we can see that even by visual inspection we can get some idea about which area is support and resistance area.
For people interested in learning these things in detail, I would recommend the book “How to make money trading with Charts” by Ashwini Gujral.

why trend lines always in diagnol why they are not horizontal.
Identifying strong support is the need
Sram
Trend lines are not always diagonal , its straight also . We call them support and resistence in normal way
manish
Becoming a better than average investor isn't hard to do since most investors don't do the research or take the time to educate themselves. Although I am a work in progress, I think I am better than average and I hope it shows with my latest stock pick, Mentor Capital (MNTR). I'm confident I won't be disappointed.
Arun
we are now moving to a whole big topic , understand that Nifty/Sensex is made up of a group of stocks , so its value/direction is determined by underlying stocks .
If Nifty has strong support , that means , lot of underlysing stocks have strong support and like that .
Other stocks which follow market trend because buying and selling happens a lot becuase of emotions and sentiments . If Nifty is 100 points up and markets are still roaring , will you sell a stock even if its not part of Index , No because Nifty going up says that overall things should go up and hence most of the stocks follow , unless there is some serious issue with it .
Understand the difference between FA and TA
FA tells what company is doing/thinking/may_do
TA tells what investots are doing/thinking/may_do
Manish
Manish
Got it! Thanks.
Now since the SENSEX or NIFTY are also composed of stocks, I can see trendlines being used there as well. Question is the trendline of the stock being analyzed is ok but there is also an overlying factor of the index itself which could push it down further or up further? So is it important also to see the general trend of the index as well before going for a SELL or BUY?
I have seen most of the cases the stocks which are not a part of the index follow its trend, of course there are outliers but the reasons could be different
Maybe I am kind of bringing Fundamental Analysis into Technical Analysis in this question. Your comments appreciated
Arun
3. Support once broken is always a SELL ,the next thing you have to decide is how strong it is and when are you going to SELL , you just dont sell when its broken , you then find a proper entry where risk is less . like after it breaks , you wait for it to come back and test that same support point and then go back . that is a less risky entry . because it can be a false breakout also .
Its very important for me that I read my blog readers comment and make sure they understand each part .. Comment as much as your can … thats not only for your learning , but for mine too 🙂
Manish
Thanks for the quick response! I have not got very technical about my answers eh! Appreciate your explaining each of the points. I really need to read up more before I can talk the talk…
Just to derive a decision from last 2 points
3. Long term support Broken .
Arun – Meaning its a SELL, is that right?
2. Long term Resistance line broken and acting as support (see prices touched the line and again bounced back up). Meaning a BUY.
I am sure it is a no brainer for you if you look at my responses above but for a novice like me, its important!
Arun
Thanks for the comments , what ever you told about 2,3,4,5 are correct … however i was expecting exact answer which should be like this /
5. short term support break down and long term Resistance bounce down , Strong signal to SELL
4. Break out from short term Resistance line and also up bounce from long term Support levels . Strong Signal to BUY
1. Long term resistance line once broken now becomes Support , Signal to BUY
3. Long term support Broken .
2. Long term Resistance line broken and acting as support (see prices touched the line and again bounced back up).
let me know if you agree or not … anywyas … i gave answers in detail .. what you said was perfectly correct either 🙂
Manish
Hi Manish,
Nice Article..
5 is a high point. There is a downtrend after 5 is hit.
3 is one of the lows where support is broken and prices go lower. It is a downtrend
2 is where the resistance gets broken and price is in a uptrend
4 is where the resistance was one of the high points in the period for which the trend line was drawn. It breaks upward and then goes above the resistance. Price is in an uptrend. Next time it approaches 4 it will act as a support.
@Uma
Regarding that video , Symetrical triangle is a triangle formed when you two trend lines meet in a triangle fashion such that one is resistance line and other is support line .
What the person is saying about is , that everytime prices start to make high … it should approach to resitance level . If it moves up a bit but does not reach resitance line , that symetrical triangle is not that powerful .
Thats called emptyness .
Manish
Nifty range for this week is 3050-3400.
3400 is strong resistance,should be used for short sell with sl 3450.
http://stockplan.blogspot.com
It is in the video named option addict analysis-drawing trendlines. No Consistency in touching the support each time creates the emptiness.But he draws symmetrical triangle and all. please make clear about the inference. Then waiting for your next materials. Thank you for your service.
@Uma
I have not seen the video in detail myself . What i can tell you about “area were no clear decision can be taken about support or resistance” is following .
There can be conditions when you are not sure if prices will hold the reistance or break above it . At that place you will fear if your decisions will be correct or not .
What you can do it to also mix other indications like Moving averages , Oscilators etc to filter out bad trades
Also you can take the trade only after some time , when things becomes very clear . Its fine to loose some part rather than loosing money .
I hope I have answered what you wanted . If not..let me know
Manish
@Uma
Thanks for the appreciation
All your answers are correct … Great job .
How to make a judgement ? : You must take appropriate step on every action . Like when prices are near support levels , and over all market conditions starts improving , you can expect prices to go up now and hence you should buy .
It can happen that your analysis may be wrong and you incur losses , you just have to make sure that if its a loss , you have to get out fast without emotions .
If you are correct . Sit Tight and dont sell your shares till every thing looks good . Dont get tempted to sell the shares when yous see them coming down a bit , its volatility .. prices will always move up and down . The best thing you can do is to trail the STOP , what it means is if you have bought something at 100 and now proces are around 140 , have your STOP at 120 , say to your self that if it comes to 120 , then i will sell my shares not before that .
Then if share move up to 170 , then increase your STOP to 150 , and like this keep increaseing your SL time from time .
This is make sure that you let your profits run . Dont concentrate on 1 or 2 trades . have a long term view
please make clear about the EMPTINESS mentioned in the video. That is the area were no clear decision can be taken about support or resistance.
the article is really good. Many lines can be drawn by different people. I am far away from how to make judgement?
please give the test answers in your next class. Very basically i followed
1. Uptrend support breakout
2.Downtrend resistance breakout
3.Again downtrend support breakout
4.Short term downtrend in an uptrend
5.Short term uptrend in an uptrend