

Did you invest in ELSS recently for tax saving? If you have done that with the intention of getting quick great returns in 3 yrs and then liquidate the funds, you might not like this article. Indian stock markets are seeing some serious sell-offs in the last 1-2 months and there are some reasons for it. In this article we will look at some indicators which can help you take further decisions.

Why Nifty Started Falling from levels of 6300?
You should ask why shouldn’t it fall? Everyone has bad memories about markets and 6300 in nifty is a level from where we saw one of the biggest crashes in 2008. A lot of investors had a really bad experience at that point, as they were stuck at that point and could not sell-off in 2008. They kept their stocks with them in the hope to sell it off next time when the market reach the same levels. This is what exactly happened when markets reached the levels of 6300 recently, everyone said .. “BOSS. I am now getting out of markets as I have reached my previous levels, No matter what happens next, I am just out !”, which is very natural and well-known phenomena is markets.
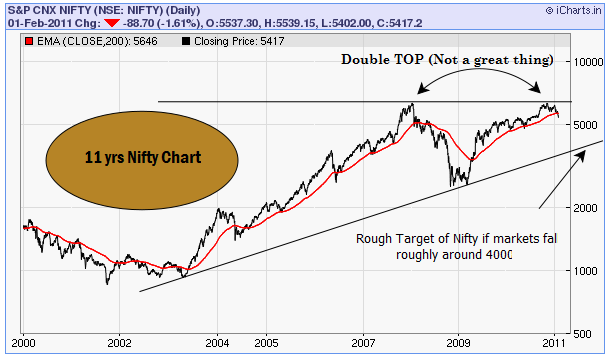
When the majority of people do this, there is serious sell-off suddenly. In technical terms, this phenomenon is called Resistance and we can see a probable double TOP at the level of 6300, not a very great thing for people looking to BUY :). I say probable double top because it will only be confirmed after markets break the target of 5350 at nifty (got this tip from Nooresh Merani). It would be a bad situation to watch ours for. Look at the last 11 yrs chart of Nifty below.

3 major indicators indicating the fall in Indian Markets
There are some serious events which are worth looking at. Let’s look at them
1. FII’s are selling
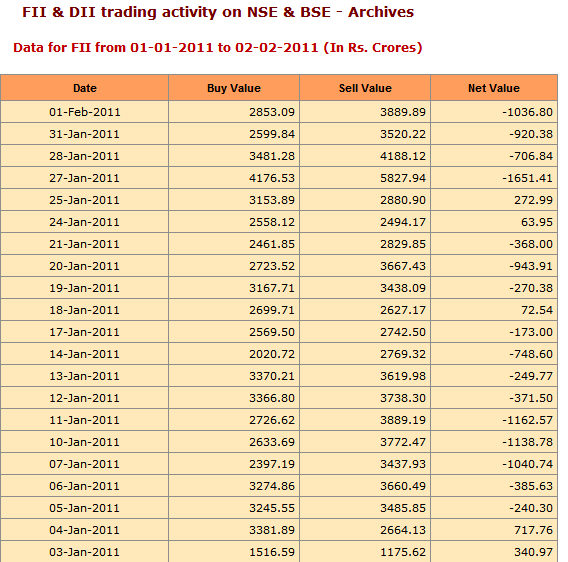
The biggest reason for the current market fall is due to FII (foreign institutional investors) selling off. Suddenly American and European markets are looking better than Indian or Asian Indices. Note that US markets are rising from last some months and Europe has outperformed Indian markets by 20%+ in Jan alone. FII’s have sold a lot of in the last 1 month, below is the data are taken from the NSE website.

However, not everyone agrees to this argument. “FII’s have invested around 50,000 crores in Indian markets from the point when Nifty was around 5,400 last time, which was around Aug 2010, However FII’s have sold taken out just 15% of what they invested, and right now we are at the same levels , so still lot of FII’s money is lying around.
So, the biggest reason for the fall is the fear of rising inflation and interest rates and the way it will affect our markets and economy in coming days”- says Deepak Shenoy of Capitalmind.in .
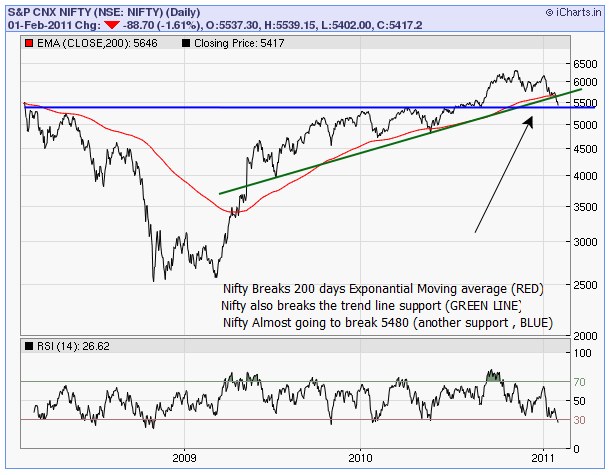
2. Markets broke its 200 day EMA + important Support points
This is not a small thing to ignore, breaking of 200 EMA is a significant event, and it has happened only twice in last 2 yrs, but it bounced back from that point, However, this time it has broken it again and got below it and not bouncing back. Incase it does not bounce back above it, It’s not a comfortable situation. So if you know GOD personally, please pray.
Look at the 3 yrs chart below which shows the 200 EMA breaking and other trend line breaking. Learn more about Support and Resistance and other important things related to stock markets here, here and here
Should retail Investor Buy right now for the long-term?
I had a talk with Nooresh Merani, a technical analyst at Analyse India, and he feels that the main panic button is still not triggered.
As per him – “The major point comes at 5350 on Nifty which is very crucial, we can not say we are entering a Bear market unless market crashes below the levels of 5350. If that is broken, then there can be further weakness in Indian markets and sell off, However if markets bounce back from these levels of 5350-5400 and go up further, it would be safe to buy only if markets move above 5700 levels , unless then better to be high on cash and not take any action. If markets can move above 5700 again , it would be a great idea to deploy cash and see levels of 6800-6900 on Nifty” – Nooresh Merani (blog) .

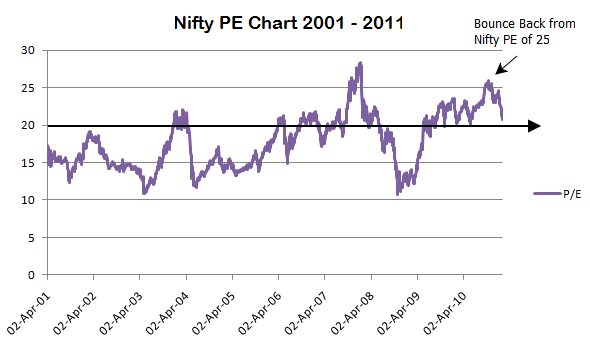
3. Nifty PE touched 25 and now moving down
Please read this post on Nifty PE incase you have no idea what is it. Nifty PE has been a good indicator till now to show the over-bought and over-sold regions and we can expect it to be a good indicator. In the last 10 yrs, It was the second time when Nifty PE went beyond 25, Only in 2007-2008 it was around 27-28 and even body knows what happened after that. Even now Nifty PE touched 25 and now it’s moving towards 20, I would not be very bullish for long-term in this kind of scenario. But there are cases where it has bounced back from 20 again to move higher, so keep it as a possibility. See the chart below which shows you the Nifty PE movement in the last 10 yrs.

Conclusion
Technical analysis is an art of reading charts and there are some serious concerns seen in the chart, however, it’s not at all recommended to take the words on rock and believe it blindly. This article and the information here are to facilitate your decision-making process. By no means, this article suggests you sell off anything.
If you are a long-term investor with monthly SIP’s running in Mutual funds, you should better concentrate on what you are good at in life and keep your SIP’s running. Only traders or short-term investors trying to catch the market movements should take decisions based on the information provided. Also if you are going to invest in markets or mutual funds for 1-3 yrs and are a first-time investor, you should understand that there is a possibility that you do not get much out of markets in returns.
Comments please. Give your comments on the charts above and what do you think should be the next move? Let’s not predict, but prepare ourselves for whatever happens next.
Note : Nifty was at 5526 at the time of publishing this article .