

Hi
This is 4th part of the “How to be a better than average Investor” series of articles. Today’s lesson is on Oscillators .
What are Oscillators :
Oscillators are the indicators which move from overbought to oversold area, generally from 0 to 100. when they are nearing 100 it means stocks are overbought and “expected” to go down now. when they are nearing 0, it means, stocks are in oversold area and fresh buying can come and move the stock up.
hey .. wait a min, did you vote on the poll upper right side, I have asked on what all topics do you want me to write. Please select topics from them, so that you also get to read your favorite thing some time 🙂 cheers … go ahead ..
I will discuss just 2 oscillators which Investors can use to make better BUY AND SELL decisions.
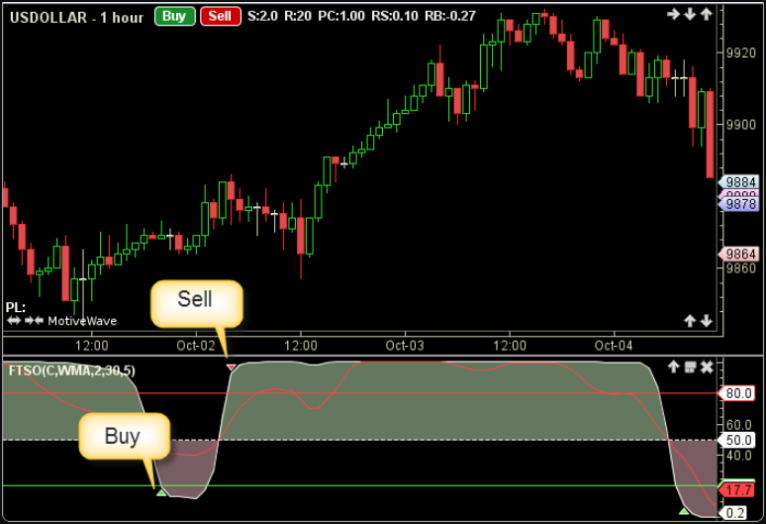
Let take a time frame of 6 months and see how indicators gave signals of buy and sell. We will see 2 indicators here RSI and Slow Stocastics (SS) (Read what is RSI and What is Slow Stocastic ).
Rules
When it’s overbought, we SELL the share.
When it’s oversold, we BUY the share.
SS BUY signal = when blue color line crosses down the Red line.
SS SELL signal = when blue color line crosses above the Red line.
RSI BUY signal = when RSI has moved below 30 and starts moving up.
RSI SELL signal = when RSI has moved above 70 and starts falling down.
To make signals more stronger, we will use both the indicators signal and take BUY or SELL only when both shows same kind of signal.
OVERBOUGHT = when RSI and SS both are overbought
OVERSOLD = when RSI and SS both are oversold.
Note
At any point of time, markets may be in any of 3 state.
– Uptrend
– Downtrend
– Side ways Movement
Understand that these signals work best in range bound market, like we had for last 6 months. When market were moving in range of 3100-2600. If markets are in strong Uptrend or Downtrend, these indicators will generate many false signals.
Hence, In different markets we have to use different strategies.
Uptrend Market : IN Uptrend, you should avoid selling the stock, when there is small correction, Indicators can fast move in oversold region, that is the time you should BUY. But not SELL when prices are in over bought market.
Downtrend Market : In Downtrend, you should avoid Buying the stock, only SELL when the indicators are in overbought region .
Sideways Market : In this market, you can buy and sell both.
Lets see some examples for last 6 months. This was a Sideways market (but still downward bias was there, so be careful with BUY, you can take SELL easily).
DLF Chart


ICICI Chart
RELIANCE CAPITAL


Some Important things to NOTE (very important)

Oscillators should not be used in Isolation alone, You should also confirm it with other things like Support and resistance to make your BUY or SELL more stronger.
For example : If prices are near the Overbought, but you see that prices have broken the resistance point, its tells you that you should not BUY. because Oscillators are secondary thing, prices are primary.
Also, If prices are near support and not breaking it, and oscillator are in over sold area, then its safe to BUY. Never rely just on Oscillators, they are only helping tools used with other signals.
Lets see one Chart of JaiAss for testing what you have learnt.
Questions for you
– Tell me where are the buying and selling opportunities.
– Tell me where you should have avoided the signals.
– What according to you can help along with these oscillators.
– Can you come up with some other oscillator of your own which can measure some important thing )
JAIPRAKASH ASSOCIATES CHART

ok, So finally we end the 4th part of this series of articles on Technical Analysis. I hope you have learnt some things from me.
Earlier Posts
Part 1: What is Fundamental and Technical Analysis and which should be used When
Part 2 : How to use Support and Resistance to BUY and SELL ?
Part 3 : How to use Trendlines to find Support and Resistance ?
Understand that we are not learning how to trade, we are learning some trading tools which can be used by long term traders to make better Buy and Sell decisions .
Incase you want to trade stocks/futures/options just after learning from these 4 articles, I must tell you have you have not learned even 1% required for trading. 99% is still there to be learned and over all knowledge of markets, technical analysis blah blah is just 10%. 90% is Psychology, your attitude and your Discipline.
Trading is risky and not easy to do for long term.
Leave you comments / thoughts / suggestions / and answers to test question.
hey .. wait a min, did you vote on the poll upper right side, I have asked on what all topics do you want me to write. Please select topics from them, so that you also get to read your favorite thing some time 🙂 cheers …