 Jagoinvestor
 June 1, 2009
Value Investing by using Nifty PE
Let us see some analysis of current market conditions. Most of the people are rushing to buy now for long term . but this may not be a market to buy for long term. I am myself Bullish now, but for short term not long term.

I would not be surprised to see markets rise by over 10-15% more over next 1-2 months till the Budget but sooner or later I expect.
– A nice correction if this is another bull market
– Bull rally coming to an end in the strong bear market
The simple analysis is with a simple and strong tool called PE ratio. PE ratio tells us how expensive or cheap is the current underlying. In other words what kind of value does the market provide us , irrespective of the price.
Historically Nifty has been considered and shown instances of being oversold in range of 10-13 and overbought in range of 20-25. Nifty has had a crash after after getting in the range of 20-25 and have rallied after touching the range of 10-13 .
OVERBOUGHT MOMENTS in Indian Markets
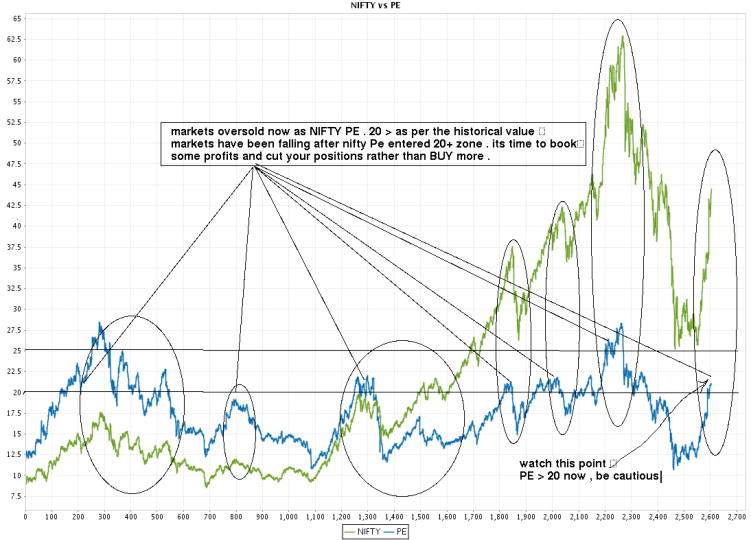
Click to enlarge , Data for last 10 yrs (Jan 1999 – 31st May 2009)
You will see that whenever nifty crossed 20. It was time to be cautious. its not exactly the time to go short sell, but at least book your partial profits and be cautious with further buying for long term.
Current situation : As I write this, Nifty PE is around 21. Its not a very good situation to madly buy for long term. Its a time when euphoria is at high point and it can take markets a little further. So you can jump in now with short term perspective, not long term !!, because markets may fall in some weeks or months.
Expect it. but don’t force it !! .
To get any future Posts , why not Subscribe to Get Posts in Email or RSS Reader
OVERSOLD MOMENTS in Indian Markets
Who all missed the current Rally? I missed it. there are two reasons, I am a trader not an investor for long term (at least currently).
So I do not concentrate on it. But you could have not missed it if you had read this concept earlier and had the guts to go against the so called “experts on CNBC” who were talking about 5k or 6k for NIFTY some months back.
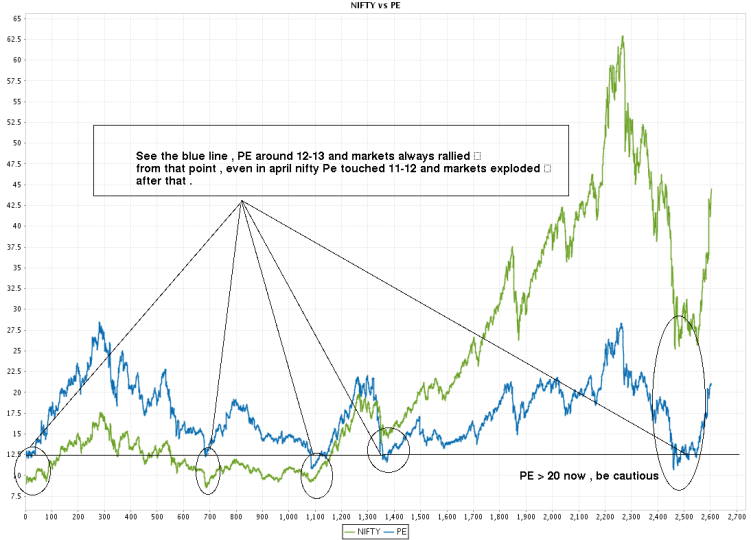
Click to enlarge , Data for last 10 yrs (Jan 1999 – 31st May 2009)
If you see the chart, you can see that after touching the PE levels of 11-13, markets have rallied back as it was too oversold !! Again, just touching these levels of PE does not signal a BUY, its only a signal to be cautious and make your mind for long side, and start the accumulation process without fear.
Markets will still make lower levels and experts on CNBC will still cry over economy conditions and world coming to an end. But market rewards the “risk assumption”, not the actions on obvious facts. You also have to decide how much money of your portfolio would you like to put in stock market after considering your risk-appetite.
What can we learn from this PE Concept?
“We can learn from history that we do not learn from History”
This is true for almost 95% of the long term investors all over the world. They do not learn things, they do not do any research, they do not go and read blogs or tons of informational sites, they just want tips from others and make money. the mathematical expectation of that kind of investing is negative and cant work for long term.
Lets develop a simple concept of PE based Investing. here it is:
BUY Signal : Once PE crosses below 13.
When NIFTY PE reached levels of 13 , start accumulating the stocks and invest your money in 4-5 installment over some months. Make sure that markets are going up and down and moving in a range . If PE crosses below 11 , its a must BUY !!
SELL Signal : Once PE crosses above 20.
Book the profit once NIFTY PE crosses above 20, Don’t book all profits at once. Book it in parts. PE crossing above 20 does not mean markets has to fall, its only an indication that markets may be oversold and now “smart people” will starting selling there shares to mad public.
Short sell the shares once PE and Markets start falling down from PE levels of 20. If PE crosses above 25, its a must SELL !!
There have been cases of PE going up to 25-28 levels. That will happen at the peak of strong bull markets like Jan 2008. In very strong bull markets you have to understand that PE will cross even above or below its extreme points. That’s the risk part of stock markets from which not even GOD can save you from !! 🙂
This is the time when your buying in parts and putting capital which you can afford to loose will help !!
Anyone who puts 100% of there money in stock market at once on one single time on a single bet has a secret affair with financial disaster which he/she himself is not aware of. So don’t put all your money at once. Only put a part of your capital at any point .
Where do you get the PE data for Indices? (Nifty and other Indices)
NIFTY data : https://www.nseindia.com/content/indices/ind_histvalues.htm
PE data : https://www.nseindia.com/content/indices/ind_pepbyield.htm
Note :
- I have divided Nifty Value by 100 to make the graph look the way it is . In graphs , so on X axis if you see 40 , then read it as 4000 for nifty . but exact 40 for PE .
- PE value will be separate for individual stocks as PE ratio for stock can go up or down for many other reasons . So if you are doing Stock analysis , see its historical PE values and find some pattern yourself . Innovate !!
I hope you have got a clear idea about Nifty PE. If you still have any confusion you can leave your query in our comment section. Also do let us know your opinion about this article.

Great Article!!! Love your blog.
Thanks for your comment Sanjay
Thank you for such a informative article. I am a learner and silent reader of jagoinvestor…..wish to get some more detailed discussion regarding “valuation of stock” or approach to pick promising stock.
sure ..
Pls share some info about p/e for Tcs over last 10 years…
Rightly said brother
A very intelligent blog, with awsome market insight. I salute to the creater for the same. The bloodbath in the markets have just begun. Just waiting for the 13 PE to begin my investment in Nifty Bees. Cheers
Thanks for your comment Lokesh Tiwari
Hello Manish it really an eye opener, I am felling that I am reading this article at right time as right now nifty pe is 23.80 as of 28-Feb-2015. Thanks for nice article.
Hi Chandra Mohan Baloni
Good to hear that !
how about investing in a p/e equity mutual fund and left to the fund and expect the desired result
@Param,
It does not make sense and it will underperform because even if PE is at high level, the Fund will have minimum 65 percent allocation to equity if it’s an Equity Fund. As am individual if market expensive one can exit fully and park in Debt till the time PE falls to attractive levels to re enter.
Hi Manish,
Do you have the data which shows that If I had invested Rs 100 in Nifty 10 years ago and based on the PE movements made the switches, then what would be corpus today?
Did this PE based approach outperform buy and strategy over lat 10 years?
Could you please update the link on nseindia.com to check the PE values. I am unable to get it on the new site of NSE.
Thanks
Prasanna
Can you do that yourself and let us also know the updated links !
Hi Manish,
Just wanted to clarify – the chart that you posted in 2009 with the PE values – is that based on trailing twelve months or 1-year forward PE? Tried to see if its clarified anywhere but you haven’t mentioned it specifically. Would appreciate a response. Am doing some analysis myself and will post the results when I am done. Again, good job with the blog. Cheers.
That was taken from NSE website , so it must be trailing one i guess
good job manish keep it up
dear Manish,
i am new to stock market and want to know buying /selling stocks in BSE and how to trade in nifty. how it is different together. thanks for your help, you are doing in this blog.
Hi Manish, I am a big fan of your blog.How true was this post , when it was posted a year ago.I am a long term investor ,investing via mutual funds for the last 6-7 years.One thing I am confused of,The PE of Sensex/Nifty according to BSE/NSE website is app. 17.5,while Bloomberg quotes the PE at 15.5.Even the experts on CNBC keep on saying the current PE is around 15.I researched on the net and found that the difference is because the EPS is calculated by standalone method in BSE and by consolidated method in Bloomberg.
What you think is the current PE.and which one Investor should follow for investments.
Pankaj
I am not aware of those details actually .. there are two kinds of PE , trailing and current , so there can be the difference actually .. I cant give a recommendation or view on markets at the moment, i am not the best person in that
Manish
DEAR MANISH ,
I HAVE JOINED RECENTLY , I DONT HAVE WORDS TO EXPRESS.
ONE THING I WILL SAY — THANKS FOR ENRICHING US , VIEW HAS BEEN CHANGED COMPLETELY RGDING INVESTING
THANKS A TON DUDE FOR SUCH AMAZING THINGS
KEEP IT UP , YOU A LIGHT HOUSE FOR ROOKIE LIKE US
Sandeep
Good to hear that from you .. keep reading and posting 🙂
Manish
G8 artical for understanding in a simple mannar.
Manish can we see historical individual stock P/E for as above analysis ???
Awaiting for your kind analysis skill …..
mitesh
Mitesh
Stocks PE are generally not available for many years .
Manish
Manish,
I am wondering how you are getting many many matters in various finacial topics like this..How is it possible? Are you having any secret connection with IIM professors or any other financial Kings?.. Really Great..All the lines you are writing r easily understandable by anyone..
Please continoue your Job(Service) to all sleeping people not only in India all over the world..
T.S. Ashok
Readers comments, confusion give a lot of articles and apart from that , there are many ideas which come in my mind 🙂
Manish
Hi Manish,
This is the first time i am writing some comment although i am learning from your blogs long back. Really its a excellent stuff for an investor.
I really love the style of your writing, all queries covered which can be generated over on Subject line. Really a structured method.
You r doing a gr8 job. Please keep continue.
Regards
Deepak Jain
Deepak
Great to hear that .. I would love to see more comments from you .. keep communitcating and participate 🙂
Manish
This is one article filled with wonderful discussion. I feel the complete article is done only after reading the comments included.Such a great followers you have 🙂
I am in SIP for both NIFTY BEES and Junior BEEs and i am not gonna stop just because the current P/E is >20.As SIP should give me good return over a period.
Now the thing i did not understand is people saying BUY and SELL. This mean the buy NIFTYBEE and Sell NIFTYBee? at the appropriate P/E?
Also if Nifty PE is at 10-12 is that a good time to buy Nifty50 stocks?
Prabeesh
When you say that you wont not sell or buy just on NIFTY PE and continue , its fine from long term point of view ..
However If you try to do take some time out and try to transact based on Nifty PE , it gives you an edge towards buy and hold because you are doing value investing based on Nifty PE , imagine selling at highest point and then keeping your money for next 1 yrs , when markets fall by 50% and then again deploying it at lowest point when PE is around 10-12 , when it comes back to the original level , you double your money ,rather than 0% increase in case you just hold it .
Manish
Ok got it…make profit by value investing…. 🙂
if Nifty PE is at 10-12 is that a good time to buy Nifty50 stocks?
will this also be value investing if i do it?
Also is there a article or can you come up with factors linked to nifty and stocks that one should take a look
http://jagoinvestor.dev.diginnovators.site/2008/12/8-keys-ratios-to-look-at-before-buying.html
Dear Sir,
I would like to apply the PE Theory inindividual stocks such as SUZLON ENERGY and other battered stocks only to find best entry point. Is the value 10-12 in individual stocks also?
Please guide.
Madhu
No , its not exactly the same number for individual stocks , you have to find out what are min and max numbers in case of some stock . Did you get individual PE value for stocks ? from where ?
Manish
Manish,
Don’t you find it intriguing that every time the market goes down, it definitely goes to touch the 12.* (i.e. twelve point something) PE? It almost seems like all this is pre-planned by someone :). In a 10-year period, it touched the 12.* PE five times. This means 5 investment opportunities.
The thing that intrigues me is…why 12? And why 12 in such a consistent manner every time? I see no reason why in the future it shouldn’t go back to 12 because it has already happened this way consistently for 10 years.
In these 10 years (i.e. 5 times), there has not even been any great reason for the crash to 12.* levels (except the most recent time when global recession fears came in).
Any thoughts?
Thanks,
Ram.
Ram
Its not exactly 12 , but a region , 10-12 on lower side and 25-27 on higher side , its a kind of magic number which tells you over bought and over sold regions , while its not mandatory that it will happen everytime , it can move 2-3 points more down or up , depending on how mad people are and drive the market.
Its more of a technique/analysis which very less people are aware of and use and hence make better returns .
Manish
Manish,
The region on the lower side has remained the same over the past 10 years. Do you have any idea if it did the same before that?
Also, if one was planning to buy into that region and as you suggest that this region might go up or down 2-3 points depending on people…I agree that what has happened for 10 years could change in the future. So, how does one not miss the bus? What else can one analyze to say that the market is in the buyable region now?
Thanks,
Ram.
Ram
One also has to see other things like How long has this bear or bull market run and other indicators of technical analysis . You will have to learn those and how to see long term charts .
However , it would be tough to time the markets its different everytime and your guess can go terribly wrong 🙂
Manish
Manish,
Thanks again. Your article archive is a wealth of knowledge. Hats off to your efforts. Your knowledge and your desire to do something with that is commendable.
Ram.