 Jagoinvestor
 December 30, 2020
Getting Bad returns from your mutual fund? Do the Rolling Returns Analysis!
Not happy with your mutual fund performance?
Do you think its a bad mutual fund, because it is not doing well from last many years?
A lot of mutual funds investors lose their patience looking at their mutual fund’s returns after they invest for 2-3 yrs. Its commonly suggested that an equity mutual fund will perform very good over the long term and one can expect double-digit returns, however, if the fund does not return back good returns within 2-3 yrs itself, the investors get very nervous and start judging their mutual fund quality and wonder if they made a right choice or not!
Today I will tell you how to judge the returns of mutual funds using “Rolling Returns” analysis, which will help you to get more confidence in your mutual fund and will help you learn many aspects!
Let’s start!
You Returns will invest a lot depending on when you invested!
Before we go into rolling returns, let’s understand the issue!
Take HDFC Midcap opportunities growth for example
- 10 yrs CAGR return: 14.96%
- 5 yrs CAGR return: 11.26%
At the time of writing this article, the returns from this fund are very good. But can this fund give bad returns in a 2 yr period. The truth is that this same “good fund” can give very different kind of returns in a 2/3 yr period depending on when you bought the fund.
Here is some data.
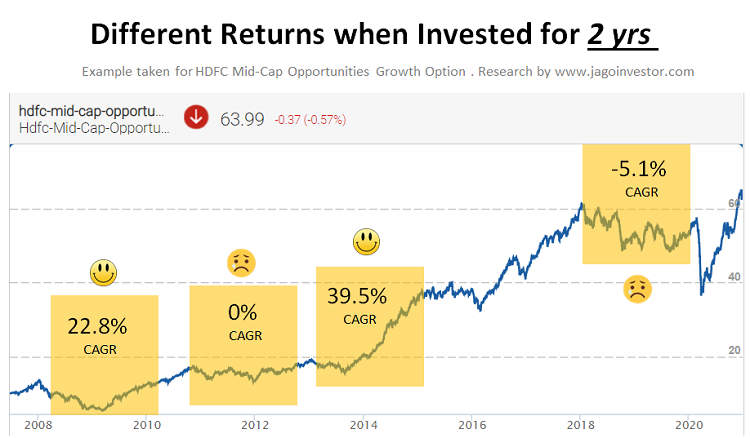
You can see that the 2 yrs return can be 22.8%, 0%, 39.5% or -5.1% depending on when a person entered the fund. So a lot depends on when you entered in the fund.
Now let’s see the same thing for 3 yr time frame. 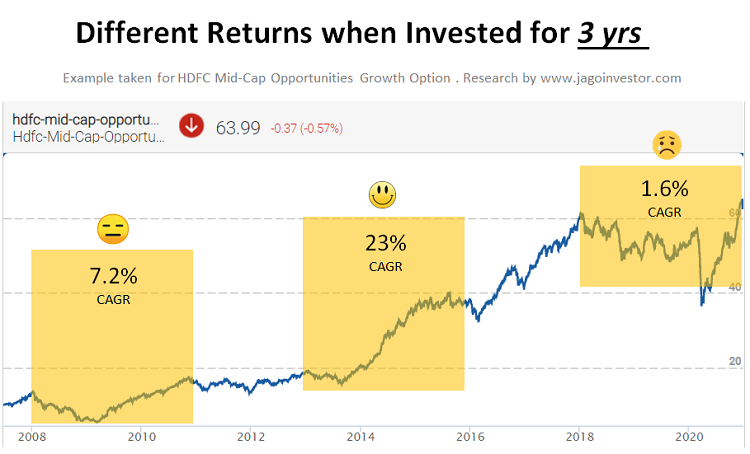
Again, you can see that for a 3 yr period – the experience can be very very different. It’s not always possible to enter at the lowest point and many times, investors invest their money for the long term when the near term returns are going to be bad. However, they never get prepared for this.
Investor mind is also not designed to stay calm when returns go in negative and that’s when investors make a wrong choice of exiting the funds even if at the fundamental level, the fund has no issues and its just the volatility of the equity which is driving the fund into negative return zone!
You can see that this approach of just looking at the point to point return does not give you enough detailed information about the fund and its volatility.
Rolling Returns – What it is and How to look at it!
Rolling return means a series of returns data for each and everyday investment for a certain time frame.
So in our example of HDFC Midcap opportunities, lets assume a period of 14 yrs from 1st Jan 2007 to 30th Dec 2020. Thats approx 5110 days. If you do a 2 yr rolling return analysis, it means that a period if investing for 2 yrs and you are plotting the CAGR return for each day of investment from the start. (that’s 730 days of investment)
So you invest on
- 1st Jan 2020 and exit on 1st Jan 2022 (1st instance)
- 2nd Jan 2020 and exit on 2nd Jan 2022 (2nd Instance)
- 3rd Jan 2020 and exit on 3rd Jan 2022 (3rd Instance)
- ….
- ….
- ….
- 30th Dec 2018 and exit on 30th Dec 2020 (4380 instances: 5110 – 730)
So you can plot these 4380 data points and that graph is called a rolling returns graph. In the same way, you can have a 3 yr, 5 yr or even 10 yr rolling return graph.
Check out the example of HDFC Midcap opportunities rolling return chart for 2 and 3 yrs period for last 14 yrs. You can see that in a 2 yr period, the highest CAGR has been around 60% and the lowest at -16% .. So it’s possible to see your investment go down by 16% in a 2yr period as per old data. The same kind of data is there for 3 yrs period too!
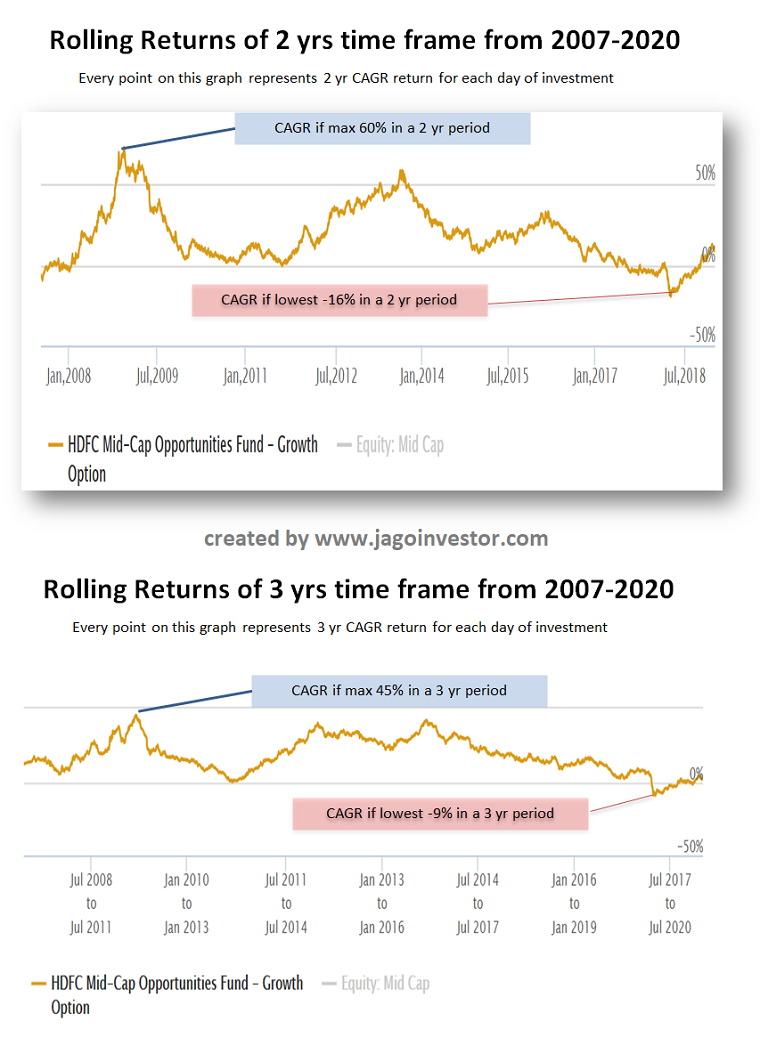
Rolling return graph will give you a deeper understanding of how volatile fund returns have been and even the probability of your return being in a certain range (only with past data). Note that its only historical data and the maximum and minimum returns can change depending on future performance.
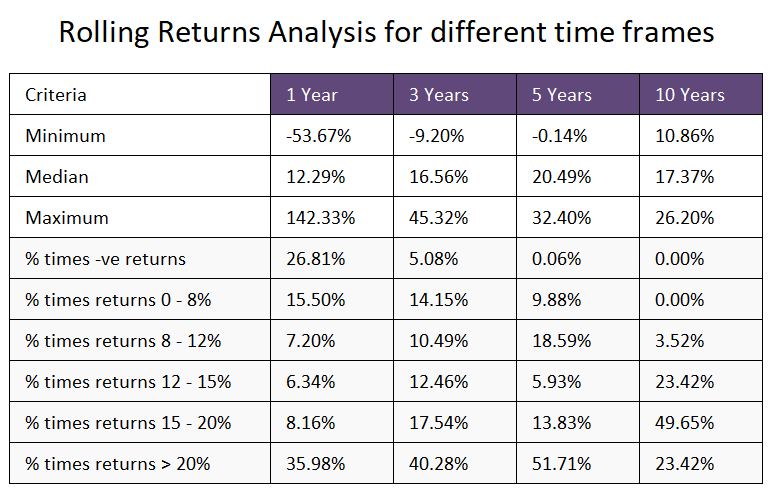
If you look at the chart above, you can conclude that if you want to invest in this fund – then you can see a downside of up to 10% in a 3 yr period because it has happened in the past. Also, you can see flat returns even in 5 yrs period which has happened in the past.
This kind of analysis tells you that because of volatility even this kind of good funds can see a period of non-performance and flat returns.
I hope I was able to explain what is rolling return in a simple manner.
Conclusion
Remember that rolling returns exercise is a great tool for analyzing the mutual fund, but it’s not the final exercise in itself. There are many other kinds of analysis which is possible and this exercise alone does not give any final judgement.
If you are not happy with your fund performance, then I suggest going through this exercise!
Do share your comments on this!

Hello,
Where can I get Rolling Return data for indexes like Sensex or N50? OR Rolling returns for any specific mutual funds for different frequency (monthly or 1 year or 2 year)?
Thanks.
Advisorkhoj.com
Thanks for your valuable advice.
I answered my questions in detail with a full explanation that cleared my doubt. Only thing it remains is – Then, what basis we must take action to switch it to some other. I though Percentage return would be the one.?
Thanks again
Thanking you
If the current fund is not performing and not beating your benchmark, then you shall
Hi Manish
I am invested in Motilal Oswal Multicap 35 fund since last 3 yrs, through monthly SIP. Currently it is giving me an XIRR of 27-28% , but the reviews across various platforms for this fund is not good at all. This worries me, and I keep thinking that should I move out of this fund to a different fund , or should I still hold.
My goal is around 6-7 Yrs away.
Its a good fund.. just keep it .
But remember that 27-28% of CAGR is unsustainable and it will come down
Also this fund is very volatile, so make sure it fits your temperament!
Thanks for the input, that fund is good ! It comes as a relief 🙂
True , I would have to maintain patience . As I said , I am more than glad to hold this for 6-7 yrs.
HI Manish,
Appreciate your efforts in bringing this useful article to us.
Thanks & regards
Welcome!
A common man does not have the daily data of funds to perform this analysis. My principle is simple. Since stock markets are volatile
with plenty of swings, park the funds in short -term deposits of six months to one year Wait for the stock market to drop by about 15 to 20% from the current levels and then enter mutual funds or stocks. Never enter the market when it is at peak as there is a very likelihood of mutual fund going down with the market in the next downward swing.
You dont have to do much analysis and this analysis is all available online on various websites.. takes 10 min to do it.
Anyways, if your strategy is working for you then stick to it. Each person has to decide his own path and I am glad you found one and you are clear about it!
Best of luck
Manish
Similarly I have decided to adopt following strategy:
Continuing some amount with SIP and rest with liquid fund. Waiting for a big fall of 30% or more from preceding peak so that I can invest lump sum amount accumulated in the liquid fund. I think such a big correction is obvious but I need to be patient to wait for 6 months or 1 year or 2 years.
Hi! In the conclusion section of article on RR for MF, you mention that apart from RR analysis, there are other ways to analyse MF. Are you referring to parameters like sharpe ratio, R2, or something else?
Yes those are some, then there is quartile performance analysis to understand the consistency. Downside upside capture ratio etc etc..
There are many! like Scatter plot of risk and reward ratio!
Manish
My question are:
1. If a MF performance is less than 10% return Annually, do we have to exit from that and put money in other MFs? If yes, then, again it will start from scratch. What about our law of compounding average that we had maintained for 4/5 years? We will loose that. How to handle this scenario so that we do not loose on the Return
2. I read in some of your article that we should not have more than 4/5 MFs. If we have more than that, exiting – will it be a good idea after 4/5 years? How to handle this scenario?
Hi Raj
1. Can you explain how will we loose the power of compounding if you exit from a fund and move to another fund? Give me some numbers and example !
2. 4-5 funds is a thumb rule. You can extend up to 6-7 .. but if there are just too many , then its an issue!
Manish
Thanks for reply. I am an avid reader of your written material for last 5+ years since it was started as a blog. I liked the practical knowledge we get to know through these.
My understanding is this :-
If I have 1000 Units for (lets say MF A unit price = 200) and is giving me under 10% return annually whose current value comes to Rs 50,000.
If I move/switch to (MF B unit price = 400) using STP or even lump sum then 50000/400 = 125. Only 125 units would be alloted to me in this new MF-B. Plus, there would be some fee as handling charges also. That way I will end up less units allocated to me in this new MF B. What do you say?
Please correct my understanding.
Will STP be the best way to switch to other MF ?
What should be our criteria target CAGR %Age for MF performance to switch it to some other MF?
I think you have some wrong notion here about compounding benefits .. Compounding is a concept that you are in an asset class and don’t get out of it completely so that any future gains/losses happens on the accumulated value ..
When you move from fund A to Fund B, you have just changed the tracked. The new number of units might more or less, but it does not matter. Mainly you have to look at the percentage gain and nothing else.
If you are in Fund A and it increases by 10% , your total value goes up by 10% .. if you move to new fund B and you get less units, but the NAV is higher (that’s why you get less units) so your total worth is same .. and now if the fund B performs 20% returns, your value goes up by 20% .. so it does not matter how much units you have.
Only when you Redeem the money and spend it, then you are stopping compounding because now the benefits of equity returns have stopped.
ALso when you switch from Fund A to Fund B, you may have to pay some taxes or in some times exit loads only when you are quitting within a year.. else its just tax.
SO yes, you may have less money in fund B, but the compounding benefits are still there ..
STP is a good way to switch to an equity fund so that big volatility is handled. not always
% performance is not a criterion to switch!
Manish
Manish
Thanks for your valuable advice.
My questions are answered in detail with full explanation that cleared my doubt. Only thing it remains is – you said, CAGR %age is not a criteria. Then, what basis we must take action to switch it to some other. I though Percentage return would be the one.?
Thanks again
CAGR is surley something to look at , but cant just depend on that. It does not reveal full information ! .. that’s what I mean !
Can you please guide me: If a SIP is going to complete its tenure in next 2year from now, so :->
1. How to safely and with the same Return withdraw that amount from it? Since, it will be up and down in market return so what strategy would be best to safeguard final return on the invested money remains?
2. What means would be best to keep in that Amount? FD or liquid Fund.
Thanks
Truly speaking, you cant safeguard the value if its still invested in same fund. The only think you can do is shift it to FD or debt fund. But then you also loose any upside which might come !
Is there any article where you have covered transferring Fund Value when we are nearing maturity or nearing our goal? What would be the best strategy in terms of safe guarding our money with interest? A detail explanation would be appreciated. Thanks
Hmm.. I have not. But the point is that before 3-4 yrs when you feel the markets are on the higher side, its better to shift the value to a short term debt fund..
Incase you are not sure about market value, better do a STP of 1 yr from equity fund to debt fund before 4 yrs!
Manish
Hi,
Is there any article which explains point 1
-Manish
Read my comment to Raj!
Great article. Is there a website that can generate the rolling returns plot?
There are many on net.. just google search
Do Indian Mutual Funds not provide details on dividends announced for the fund and when the dividends get reinvested ? I have been in equity funds for close to 10 years now and don’t ever remember seeing a message about what happened to all the dividends announced by the underlying stock. Thank you !
They get reinvested as an when they come .. There are so many stocks in the portfolio that if you want to get the intimation about it, it will be literally every few weeks.
Its something which gets managed internally ..