

Hi Readers
This is 3rd part of “How to become Better than average investor” Series. Read
Fundamental and Technical Analysis, What and When ?: Part 1
Using Support and Resistance: Part 2.
Let us today discuss how can we use Trendlines to use Support and resistance levels and make better Entry or Exits.
What is a TrendLine?
A trend line is a straight line that connects two or more price points and then extends into the future to act as a line of support or resistance. In the Uptrend , we join two low prices points and in Downtrend, we join two high prices and extend it further. Next time when prices approach them, it should probably act as a Support or resistance point.
Let us see one example of each of them.
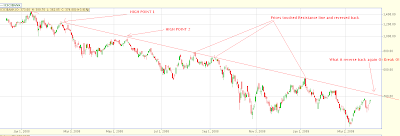
Example of trend line while DOWNTREND

You can see in the chart how Two high prices were joined and the line acted as Strong Resistance in future, 3 times prices touched it and broke down again, These are good price area where either one can go Short (sell), or book their profits. You can see that now prices are again Approaching to this Resistance line, so once prices reach this point, it may provide a good opportunity to sell.
What will happen exactly, better not to predict and let the market decide?
Understand that we are not saying that prices have to necessarily touch the Resistance line and then go back down , the trend line only provides Resistance, it may again go back much before touching it .
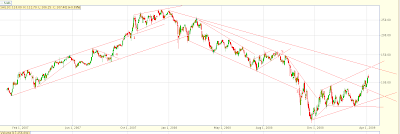
Example of trend line UPTREND
Below if the 2 yrs chart of HIND LEVER, Let us try to make a trend line which acts as support.

If you see the chart, I have connected two low prices and extended it in future, you can clearly see how it acted as support area and prices went back up from there, At the end, you can see how prices are again approaching this support area, most probably this will again hold and it should be a good BUY 🙂
Let us see one more example of Trend lines. This example will show us the following things :
– Resistance line using a trend line.
– Breakout
– How Resistance once is broken became Support
– Resistance line using trendline for a shorter time frame.
Let us see a 2 yrs chart of JAIPRAKASH ASSOCIATES

You can see here how I joined two HIGH Points and extended the trendline in the future, and how prices reacted to this Resistance line. Recently Prices broke out of this resistance line and then this same resistance line acted as the Support line and prices bounced back from there.
Also, you can see a small trendline, which was made joining the low points . you can see how prices bounced up as this support line held the prices. So, we have seen some examples of Trend lines and how they can act as Resistance or Support lines (as per situation).
Some of the important points to note are :
– It’s more of an art to making a trendline, it depends on how you make them using HIGH PRICE, CLOSE PRICE, etc.
– You can make Trendline for any time frame.
– It’s not necessary for prices to touch trendlines, you should not expect it.
– It’s a wise decision to BUY OR SELL using trendlines. If the trade goes in your favor, let your profits run, if it fails, cut your losses short and accept it. there is no problem with being wrong . even the best in Industry fail.
– Trendlines will be of no help unless you control your GREED in markets. Don’t put all your money in a single trade. Keep adequate cash for bad times.
– Once trendlines are broken, take it seriously, it has happened for a reason :).
– Make sure that the two points used to make the trendline are not very near, there should be some time gap between them to believe in them.
– More times the trendline is touched by the price stronger it becomes, And stronger is the break out from that trendline.
Test for you 🙂
Below is a chart, and I have drawn several trendlines in different time frames, I have marked some points with 1,2,3,4,5, please tell me what are each of them and comments on each point. please do it individually. Let me see who comments correctly on each of them. Also, tell me if there is any other trendline that could have been made, but I have left it?
People who are good with Videos can watch the following videos


Please comment on this article, did you like it? Was it easy to understand? Is it too difficult to use Trendlines ?
Conclusion :
So we end this Article here, We saw the Importance of Support and Resistance and how to make trendlines and use them. In the next part (last part), we will see how we can use some of the Indicators from technical Analysis to make the decision better.
Also, we can see that even by visual inspection we can get some idea about which area is support and resistance area.
For people interested in learning these things in detail, I would recommend the book “How to make money trading with Charts” by Ashwini Gujral.