

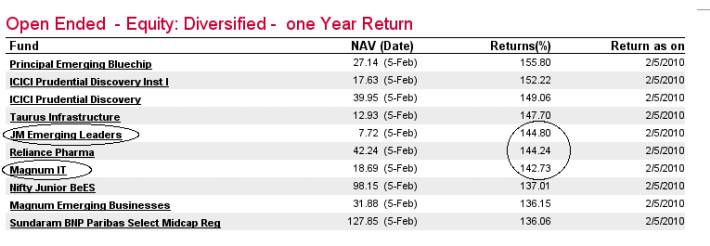
Want to buy a mutual funds which has given 105% return in 2009? Go ahead… How do most of the people choose a mutual fund? Let us try it once! Go to Valueresearchonline.com and find Top 10 funds across all the equity funds with 1 yrs performance. Below is the example of the page I got. So all these funds have given more than 100% return over the last 1 yr. Now it’s pretty simple to choose them, right? Just pick any of them and you have done your “Investment Planning”!!…… Far from the truth! Most of the mutual funds starts advertising their mutual funds “great” performance just after a strong market. They will claim that their fund has 1st rank in some blah blah category and they have the unique way of investing and what not. Let us see in this article, how we should look at short-term performing mutual funds and evaluate them on different parameters.
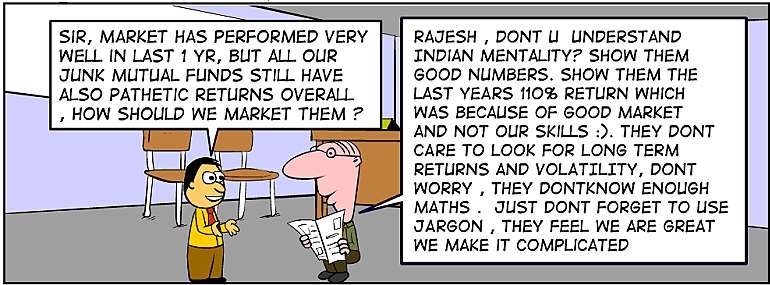
How Mutual Funds are marketed
Let’s take a case of “JM Emerging Leaders” Mutual Fund. Try to look at the points which a Mutual funds company can use to attract customers and What is the reason for each of them.
Its one of the 10 funds on the return parameter out of thousands of Mutual funds in this planet. Its 1 yr return is 144%.
[ad#big-banner]
True! But what are the reason for this? The fund is extremely risky, risky to the extent you can’t imagine! The fund portfolio looks like this:
Mid Cap: 56.18%
Small Cap: 43.82%
(as of Feb 7, 2010)
Now what else do you expect from a fund which has all 100% of its money in Either Mid cap or Small Cap companies which moves like crazy after a big bear market? If the fund is so great in 1 yr parameter, what is the reason its overall return since it came in existence is -5% (negative return in last 5 yrs)? The answer is simple, the fund is exposes to too much Risk. In order to get extremely high returns, it’s exposing itself largely to risk that the returns over long-term will be unstable and probably low.
The fund beats it’s benchmark and category average returns by huge margin
This happens for the same reasons we talked above. Benchmark is an Index and it’s returns are not based on some one’s judgement or decisions, but mutual fund returns are!! Fund manager decides how aggressively they want to invest, so if today the fund has beaten it’s benchmark or Category in positive side, tomorrow when there will be disaster, it will beat it’s benchmark by huge margin on the negative side and the performance will be much lower than the benchmark, it’s called Beta

NAV more than doubled in 1 year
Again an idiotic comment, it’s all about return, the fund has made 105% return in 2009, but what is NAV value? Ans: 7. something % . It’s 5 yrs in existence now, started from NAV of 10 and still its at 7.something. At one time in 2009 the NAV went down to Rs 2.9, this 144% year in last 1 yr has helped it come back to 7.something levels now and still the returns are the marketing factors. I am wondering how it manages to get so much of investment (Fund has 262 crores of Net Asset Value as of 31/01/2010). Who is putting all the money in this?
What are the Two important factors you can look at and make a quick opinion
Lets talk about two main things
- Mean
- Standard Deviation or Volatility
Mean: Mean is nothing but the average of returns over a particular time. It tells us how much can we expect over a period from the mutual fund. It’s important to look at Mean (average) of Mutual funds return so that we have an average expectation. For some period we can get 20% return, for some period we can get 10% and for some we can get -15% also. But we have to concentrate on the average. Look at average return from Equity in Long run from Indian Markets
Standard Deviation : Now this is some thing we never see, what is this? Looks like a scary term from our school maths, but dont worry, it’s very easy thing to understand. Its nothing, but how much deviation you can expect from the average. To clear the point, understand that (10,12) and (1,21), both have average of 11 but standard deviation of (1,21) is high because both the values are at much distance from their average of 11. In that same way if we have two mutual funds say Mutual fund A, which has given returns of 20% and 30% in 2 yrs and we have mutual fund B, which has given return of -10% and 60% in 2 yrs, both of them have average of 25% (simple average), but the second mutual funds B has higher standard deviation compared to A. What it means is that its more risky, the return range of B is higher. This is directly related to risk/reward. It’s very risky and very rewarding compared to mutual fund A. So it does not suit general investors who need high and consistent returns.
Look at List of Best Equity mutual funds and Debt mutual Funds
What to look at in mutual funds
So over a long term, we have to choose funds which are higher in Return and Lesser in Risk . That mean is there are two Funds X and Y, we have to look which has higher Mean and lower Standard deviation in returns. This is not true for investors who have extremely high risk appetite and want to take extra risk, in that case this will not be very much recommended.
Make sure you dont calculate these things on just 2-3 data points, make sure you have enough (at least 10-12 numbers) so that its more accurate. In the Table Below I have taken two funds which I consider BAD and 2 Funds which are GOOD and their quarterly returns from Q1 2006 – Q4 2009 (16 quarters) and finally calculated the Standard Deviation and Mean.
| Fund Names | BAD FUNDS | Average of BAD FUNDS | Average of GOOD FUNDS | GOOD FUNDS | ||
| JM Emerging Leaders-G | Magnum IT | HDFC Top 200-G | DSPBR Top 100 Eqt Reg-G | |||
| Quarters | Return in % for 1 quarter | |||||
Return in % for 1 quarterQ1 200616.196.9911.5921.6720.3522.98Q2 2006-13.69-7.53-10.61-10.09-10.83-9.34Q3 2006-0.6618.438.8916.9317.516.35Q4 20061.1529.0215.0911.01913.01Q1 2007-8.981.63-3.68-4.27-4.93-3.61Q2 200722.266.4114.3416.5915.1518.03Q3 200723.4-10.046.6815.8716.7514.99Q4 200741.659.325.4823.4620.8626.06Q1 2008-40.36-26.34-33.35-23.78-22.53-25.03Q2 2008-13.84-2.24-8.04-11.04-12.25-9.83Q3 2008-25.45-20.02-22.740.892.89-1.12Q4 2008-48.73-37.83-43.28-20.2-21.86-18.53Q1 2009-16.26-10.24-13.250.52-0.271.31Q2 200981.5858.2769.9347.4155.3339.49Q3 200924.837.6131.2119.3819.4819.27Q4 20098.3915.7712.085.085.065.09Standard Deviation
32.2424.3827.0718.3919.5717.47Mean3.224.323.776.846.866.82
Interpretation of the numbers
So you can see the Standard deviation and mean of returns for 2 Bad Funds and 2 Good funds and their mean return and mean standard deviation in a single quarter. So you can see that Bad funds have given return of around 3.77% per quarter on average (simple average , not compounded one) and the standard deviation is 27.07%, which means that it can deviate up to 27.07% on the upside or downside with 68% chances. (forget the maths, you have to go into probability and normal distribution and all those things, interested people can look for this link to get more insight on this. Similarly the good funds would return on an average 6.84% every quarter with deviation of 18.39% on upside or downside with 68% probability.
Conclusion
So, the conclusion of this whole mind boggling exercise is that we should understand that short-term performance of mutual funds is not where we should aim! We should properly evaluate the fund performance with different parameters. We should also concentrate on volatility and risk exposed by the mutual fund.