 Jagoinvestor
 January 25, 2012
8 graphs on gold price movements (86 years data)
Today I want to show you some patterns of gold prices from last few decades. There is no interpretation or conclusion but some findings and observations on gold price fluctuations in India. From last 10 yrs gold has been on a bull run and prices have multiplied many folds. In the last couple of weeks, gold prices have been extremely volatile and some analysts also predict that gold price upside movement is in threat. So I found gold prices for last 86 yrs (1925 – 2011) and did some number crunching and some graphs from which we get some interesting findings.
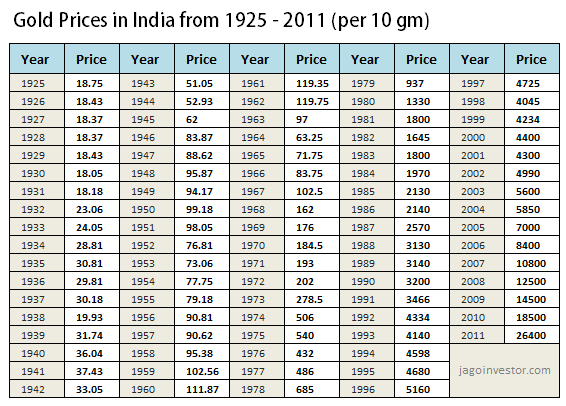
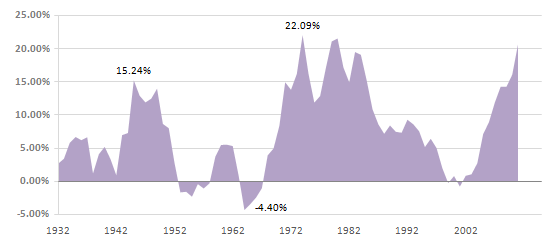
4 yrs Gold Price difference (absolute returns
I found out the price difference for every 4 yrs period i.e. from 1928 to 1925 (yrs) and saw what exactly was the difference in the prices, then 1929 – 1926 and so on… till 2007-2011. Just to give you an idea, gold price in 2008 was 12,500 and in 2011 it was 26,400; so the price difference was 111.20%. I used these data to plot a running 4 yrs price difference so at any point of time you can see how much was the return in those 4 yrs prior to that point. Note that this change in absolute in difference. The major point to note is that majority people think that gold has performed outstanding post 2000 in a time frame of 4 yrs. But from the graph you can see that in 70’s time the 4 yrs period return was much more than what investors saw in recent time.
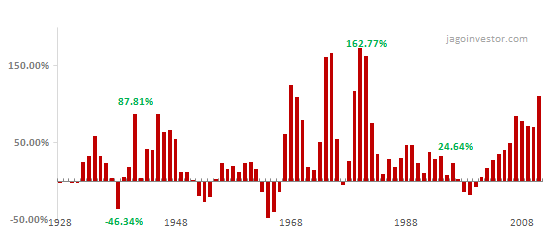
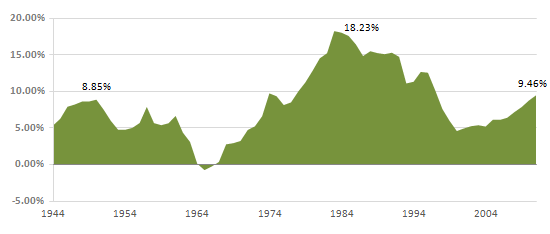
8 yrs Absolute Price difference runnin
This one is just like above chart, but this time its 8 yrs price difference. We are trying to catch that was the price change in an 8 yrs period. So for example, price in year 1980 was Rs 1330, then after 8 yrs – in 1987, the price was Rs 2570, which is a 93.23%… So like this I calculated the price difference for all the 8 yrs period and graphed it. There are very less 8 yr holding period when the returns from gold was negative, that happened 50’s and 60’s and just 90’s end.
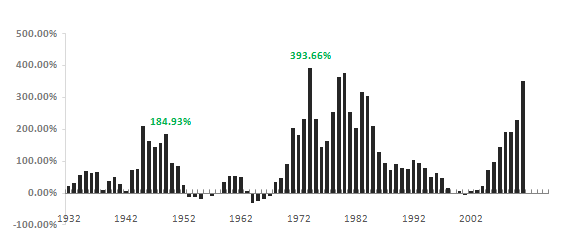
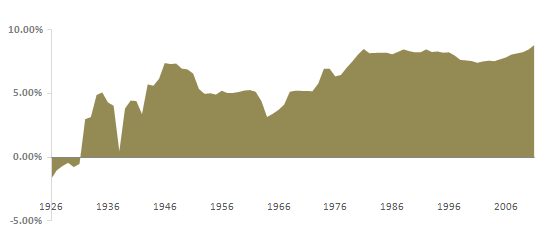
4 yrs CAGR running
The next chart is the CAGR return chart for 4 yrs time frame and the graph is for running periods… that means 1925-1928, 1926-1929… 2008-2011. CAGR return is the main indicator of the performance of any instrument. If you look at the chart below you can see the ups and downs in gold performance and you can see how gold has performed in short run (4 yrs period) for a long time line. You can see that gold returns touched 20%-25% in 70’s and even in recent time it has performed wonderfully… which we all are aware of :).
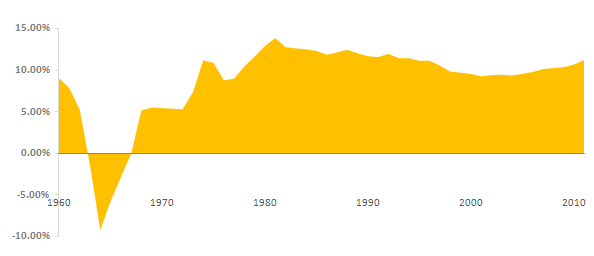
8 yrs CAGR running
Then you can see the graph below which shows CAGR return on 8 yr running period. The interesting a little obvious fact is that it hardly gave any negative return in any 8 yrs time frame, only during 50’s and late 90’s it has performed badly.
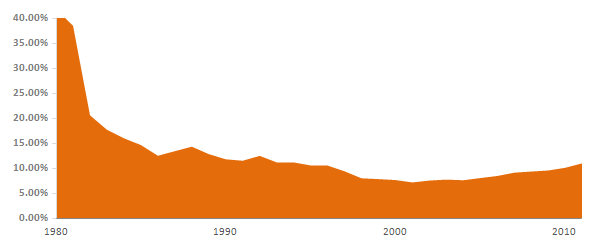
20 yrs CAGR running
The real test of gold comes from a very long term performance and if we see a 20 yrs CAGR return on rolling basis (1925 – 1944, 1926-1945… 1992-2011), then you can see that most of the times the returns has been in the range of 5-10% and only in the 80’s people got best return if they had bought it in 60’s.
CAGR from 1926 (base year)
This chart is interesting; it calculates the CAGR return of GOLD from 1926 to all the years. I mean CAGR return from 1925- 1926, 1925-1927, 1925-1928 and then 1925-2011… So the base year is always 1925. This shows you what was the very long term CAGR return of gold considering it was bought in 1925. In a way this does not give us very strong conclusion, but still shows us some perspective.
CAGR from 1960 (base year)
This graph is same as above just that the base year taken was 1960 so considering gold was bought in 1960, the graph shows the CAGR return for different holding periods. You can see that apart from those who sold the gold in 80’s realised the best CAGR return, but those who held it for long, still have the returns in range of below 10%.
CAGR from 1980 (base year)
The last chart I want to show is with base year of 1980, you can see that over the long term the returns have converged to 10% & only in the last 10 yrs you can see the returns again going up.

unable to get the analysis 1980 price 1330 and in 2010 it cost 18500 then it is 1290% but why u mentioned 10% ?
Its CAGR return .. not point to point return
[…] has done an excellent analysis on the gold price movement in various time periods. You should check out his post and go through all the charts in his post, but for sake of convenience, I have reproduced one of […]
Where on the internet? Is it a reliable source?
I am not emotional about Gold at all but now i know why people buy it- As hedge against inflation. Although they sell it if there is no other avenue. But i dont understand why is government trying to curb purchase of gold? wont it lead to smuggling? Cant governments push ETF in a big way so that they can curb smuggling??
Very informative graphs.
May I ask where you got the raw data from? Am I right in assuming this is the nominal price of gold in INR?
Thank You
I got it from internet !
Excellent piece of information, I had come to know about your website from my friend kishore, pune,i have read atleast 8
posts of yours by now, and let me tell you, your site gives the best and the most interesting information. This is just the
kind of information that i had been looking for, i’m already your rss reader now and i would regularly watch out for the new
posts, once again hats off to you! Thanx a lot once again
Thanks
Hi Manish,
Need your advise-Thinking of selling Gold and buying property. Do you think it is a sensible thought or should I stick with Gold.
Thanks in advance.
This is not a question anyone can answer you , if property is important for you, then go ahead, else not !
can you include the gold price of 2012
How will it make difference to the conclusion ?
Dear
This will be my frist comment reguarding the gold.
I just want to know that wheather the rates will go Up/Down , what ever you may know just share with me
Anil
Do you think its possible to say that ? If it was known already , people would make millions !
you are talking about percentage.what its actually 12% means 1 per interest like that you are telling
Not sure what you mean ?
Hi
We are getting a personal loan for supporting my husband’s business. I am thinking i will buy gold ornaments- plain with least making charges and wastages. I would keep them for gold loan and give my husband the money for his business. I would slowly take back the gold. By which i can support my husband and slowly saving. We have zero savings as of now and lots of debt as he started his business. I am not sure how much we can get return in business for this investment and hence thinking about this idea. We need to buy ornaments as they dont accept coins for gold loan. Will this be a wise decision? i dont want any big returns but wanted to save atleats this loan amount (10 lk). Please advice???… I request not to advice on alternate investment – my condtion is not having money in hand and looking for option. It is before i throw money into blackhole (as we donno what will happen in our business), im just thinking of way that i will get back this sometime in future. Please advice as early as possible.
Regards
Why dont you just go for a business loan with bank ? How does your situation help ?
[…] has done an excellent analysis on the gold price movement in various time periods. You should check out his post and go through all the charts in his post, but for sake of convenience, I have reproduced one of […]
Manish
One more point. I really liked the charts – especially the 20 year time period chart – this explains so well, that unless you time your purchase and selling very well, gold is not that great an investment. Saying that, yes, credit goes to people who bought gold 5 years ago, returns from gold is 670% while return from equity is <5%:)
Regards
Abhinav
Yes Abhinav .. all kind of charts have wealth of info inside it and its upto you what you interpret out of it
Hi Manish
Thanks for the post. I have been researching on why and to what extent one should invest in Gold. In that regard, if you visit the World Gold Council website (www.gold.org) they have done analysis and research over various periods and found out that since gold has a very low co-relation with other equity classes, a 2.5%-9% gold holding in portfolio reduces the risk-adjusted return of the overall portfolio. Also, during times of crisis, like 1996 -98 East Asian Crisis, and 2008 crisis, it was found that gold had a very small negative correlation with equity, which reduced the VaR (Vaue at Risk – possibility of worst loss) of portfolio in such times.
note that this research may be biased, but question is – If Gold council itself recommends not more than 9% gold in one’s equity portfolio – is there a sense in investing more and more in gold. In my view, gold is a fantastic risk management tool, which should constitute 5-10% of overall investment portfolio at all times, coupled with periodic asset re-balancing (i.e. booking profits and investing in other asset class when it crosses that threshold)
Regards
Abhinav
Is that report findings true for indian environment as well ?
The only time to invest in gold is when you have no faith in the currency – such as times of wars. Even then, you can buy real assets such as land which give the same benefit i.e. protection against inflation (however much more illiquid and not easy to move around).
Gold also carries a security cost. You need to keep it in a locker, and you run the risk of it getting stolen.
Equity or land are so much better in terms of investment for long term that I don’t know why people are crazy about gold.
Roopesh
Good point
One reason I can think of for investing in gold rather than real estate is the higher incidence of fraud. In big cities like Bangalore where land shark are rampant, it is very difficult to clearly identify if a real estate is clear from all legal perspectives. Even if a lawyer indicates it is clear at the time of purchase, you never know who stakes a claim in it in the future. This will not happen in gold if purchased from reliable sources like government refinery etc.
Security is no more an issue as you have something know as egold
Investing in gold for 1 year is better or investing in FD for 9% is better ?
If gold prices will move higher than FD rates , then its better !
hey it helped me a lot in writin ma assignment,,, 🙂
Good to hear that !
do you think investing for gold for a year is a good idea? what returns can one expect after the current growth in september…will it sustain?
No one can answer about the future of gold like this
Hi Manish,
Is it a good time to invest in Gold or in Silver for long term like 25 years?
Yes, if gold prices rise always , but no one can predict it !
Manish, am looking for some information on how Physical & Silver Gold rates are decided at the jewellers showroom.
Also, would like to know about conversion process of exchange bought gold into Physical gold jewellery from a jeweller. What is the cost involved. The percentage of mix
Could you point me to any resource on this kind of information?
Sujit
I guess you can discuss it on our forum http://jagoinvestor.dev.diginnovators.site/forum