

Do you know how expense ratio can impact the returns on your mutual funds returns ? We often hear that expense ratio of a fund is 2% or 1.8%, but we never put lot of thought to understand its impact on our mutual funds returns and our own wealth! Lets touch this topic today in detail. For simplicity, I will talk about Mutual funds in this article, but expense ratio as a concept is applicable in almost all the management financial products like Mutual funds, UlIP’s , NPS etc

What is expense ratio in Mutual Funds?
Let me first clear out what is expense ratio? As an investor we just buy and sell mutual funds, but in the background there are many expenses which a mutual fund (and even ULIP’s) has to incur. Some of which are; fund management fees, agent commissions, registrar fees, and selling and promoting expenses. As per SEBI regulations, the maximum expense ratio of an equity fund can be 2.5% and for a debt fund, it should not cross 2.25%.
Now who will pay for this? Obviously you have to pay for it and that’s where expense ratio comes into picture. Expense ratio is cut from your investments on daily basis from mutual funds and only after that NAV is published and that’s how you pay expense ratio. For Example, If you have invested Rs 1,00,000 in a mutual fund whose expense ratio is at 2% and suppose your mutual fund saw a growth of 0.5% in a day, which turns out to be Rs 500. You NAV won’t be 1,00,500. Before that you will have to pay 2%/365 (that’s 365th part of 2% as charges, as it’s for 1 day, remember 365 days in a year) and that would be, Rs 5.48. Hence, final value of your investment would be 1,00,000 + 500 – 5.48 = 1,00,494.50 that’s 0.4945% increase and not 0.5% .
So, the next question which will come in your mind is “So, does this small deduction really make a lot of difference?” The answer is Yes & No. If you are looking at 6 months or 1-2 yrs, it’s not much of a concern, you can probably just avoid it and answer is Yes, if you are looking from long-term point of view like 5-10-20 yrs. In that case it’s mostly something which you can put your eye on once.
Expense Ratio – With & Without
Let me first give you a very clear idea about the distinction between two scenarios where there was expense ratio and there was no expense ratio in a mutual fund. Let’s take this example at least to understand the concept.
Suppose there was a mutual fund called “Jagoinvestor-Ninja Fund” (attractive name haan!) which generates a 12% return before expense ratio. Now let’s see how this fund final returns will turn out to be in different expense ratio scenarios like 2% , 1.5% , 1% ,0.5% and 0% (imaginary) . 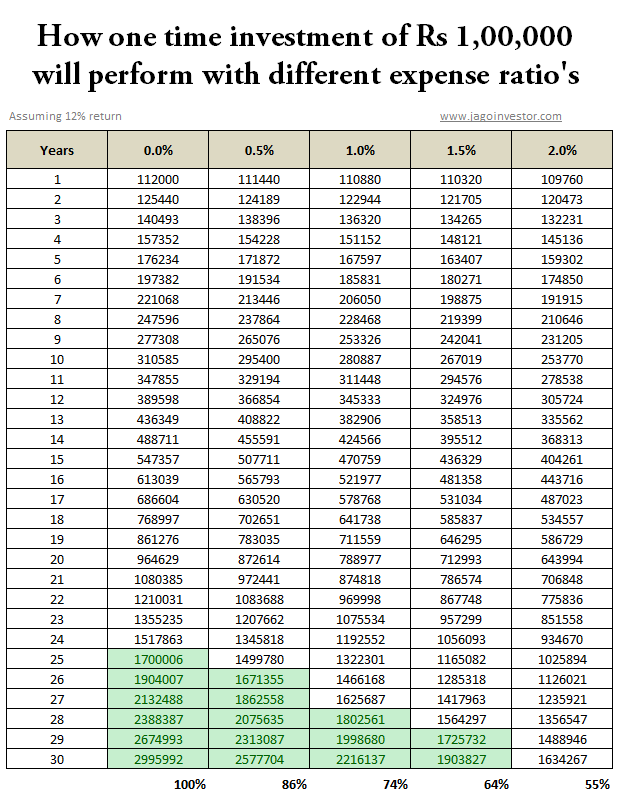

Did you see that? How same funds performance can lead to huge a huge difference depending on expense ratio. In a longer term, you can see how the corpus value reached 29.9 lacs without any expense ratio, but if the expense ratio was 2%, then despite the same performance, the corpus would be reduced to only 16.3 lacs. That’s huge deficit of 45% compared to original corpus. While it’s a little unrealistic to consider 0% expense ratio, because it’s not possible in real life. Let’s see the different between 1% and 2% expense ratio. You can see that with 1% expense ratio the corpus was 22 lacs and with 2%, it was 16 lacs, that’s again huge 20% difference.
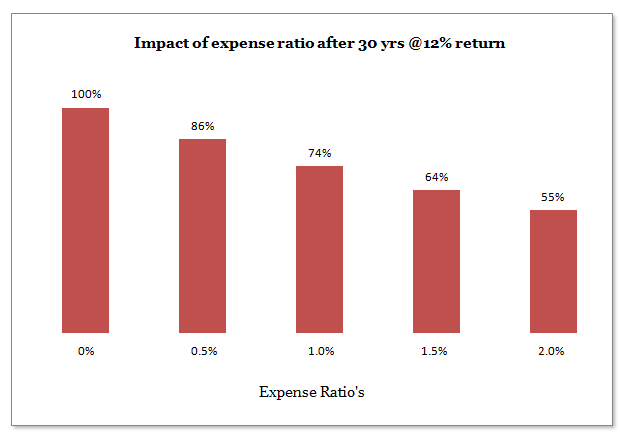
Also if you see the chart above, you can see a greed part showcasing how low expense ratio cases achieved the same corpus few years early than the high expense ratio scenario. You can see that with 0.5% expense ratio, 16 lacs was the corpus in 26th year itself which took 30 yrs in case of 2% expense ratio. In the chart below you can see how much the difference in different scenario’s final corpus percentage wise was.

Remember that when you compare returns of mutual funds in long run (video), the calculations are shown after-expenses; hence it might happen that a better fund today is better in returns because its expense ratio was lower than the other one. It might happen that two funds differ in returns to some extent, but don’t vary too much when it comes to their ability to generate returns before the expenses. Naturally the mutual funds which have lower expenses would have better return at the end.
Case Study – HDFC Tax Saver vs Canara Robeco Equity Tax Saver
If you look at Valueresearch website, it has given Canara Robeco Equity Taxsaver fund a 5 star rating, but HDFC Tax saver gets just a 4 star. If you look at both these funds history, both the funds are 15 yrs old funds and if you look at short-term performance of both the funds, you will see how Canara Robeco is doing equally good or better than HDFC Tax Saver. But if you look at long-term performance of both the funds, you will notice a big difference.
While HDFC Taxsaver stands with tall chest giving 31% annual return, Canara Robeco seems to stare the earth with just 20% annual return. Now there can be a lot of reasons for this, but if you look at expense ratio, Canara Robeco has as high as 2.49% expense ratio, where as HDFC tax saver has just 1.91% expense ratio. So it might happen that Canara Robeco these days has to perform better than HDFC Tax saver before expense ratio and only then it’s able to sustain the performance.
As per a small study by moneylife, this phenomenon is true across the category , here are the excerpts : –
Consider the performance of 43 equity diversified funds which have been in existence before 2000. We chose 2000 because we wanted to gauge decadal performance of the funds. Of these 43, we selected the 15 most expensive funds and 15 cheapest. Among the expensive lot, we have only seven outperformers and eight underperformers. Whilst among the cheap funds, we have 12 outperformers and only three underperformers. It is not that the expensive funds have not earned good returns, but a part of their returns has been washed away by their high expense ratio.
For instance, Birla Sun Life Advantage Fund, which is one of the costliest and was launched in February 1995, has given a return of 19% beating its benchmark, BSE Sensex, by a margin of 8%. Reliance Growth, launched in October 1995 (seven months later), has given a return of 28% beating its benchmark, BSE 100, by a huge 16%. Was it the pure stock-picking skill of Reliance? Maybe. But the fact is the Birla Fund has an expense ratio of 2.31% and Reliance Growth Fund has an expense ratio of just 1.79%.
Conclusion
High expense ratio will hurt you in long run, so incase you are choosing two similar looking and similar performing financial products, you should look at their cost structure.
Can you share what you took from this article and how you will apply in your financial life?