

Which one among Reality sector and Banking sector has given more returns in last 5 yrs and 10 yrs with lump sum and SIP way of investing ? Have you ever tried to find out which sectors among indian indices are doing well and which are not ? In this data-oriented article will take you into the world of different sectoral indexes on Nifty, like Bank Nifty , CNX IT , CNX Pharma , NCX FMCG and some more like those . We will see their performances compared with each other with graphs. Note that I have also taken NIFTY as one of the index to compare it with a broader index even though it’s not a sector specific .
Which sectors ?
In this study you will come to know about lump sum and SIP performance of various sectors for 5 yrs and 10 yrs time frame. I have taken the raw data from NSE website and done all the number crunching and graphing to come out with charts which shows you how money has grown in various sectors . I have taken 6 sectors ( Nifty , Bank Nifty , Energy , Pharma , FMCG) for 10 yrs time frame and 8 sectors for 5 yrs time frame (6 mentioned earlier + Reality + Infra ) . We will see the results of 4 different scenarios and will see major learnings from those .
10 yrs performance [Lumpsum Investment]
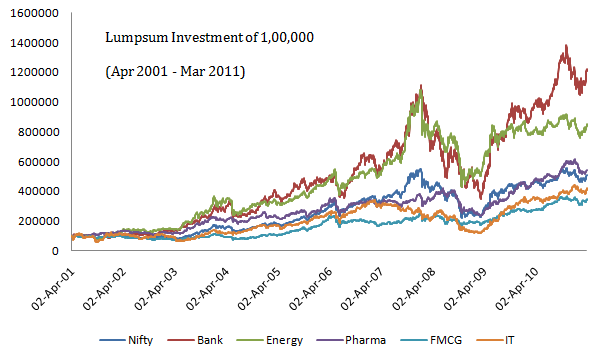
The chart below shows the sectoral performance + Nifty for a lump sum investment of Rs 1 lac in last 10 yrs .
Observations
- Bank Nifty was the clear out performer among all giving a 12x return in just 10 yrs . That’s very good return . Energy sector came second and FMCG and IT sector gave the least returns out of all .
- Bank Nifty has given 3x return after the crash of 2008-09 . Look at the big spike upwards . Till the crash Energy sector was performing same to same as Bank Nifty , but after the crash, performance of Energy sector deteriorated and it didn’t match up with Bank Nifty.
10 yrs performance [Daily SIP Investment]
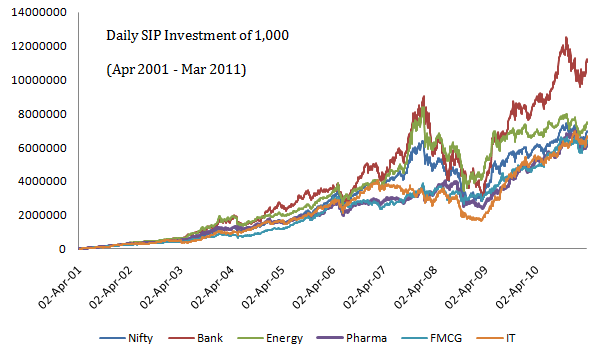
The chart below shows the sectoral performance + Nifty for a daily SIP investment of Rs 1,000 in last 10 yrs .

Observations
- The most insight full thing you can see here is that all the sectors other than Bank Nifty has given very close return if one had done SIP regularly . This shows both, the power and weakness of SIP . You can get more returns out of bad sector and less return from the strong sector .
- IT sector performed very badly after the crash , but in the recent bull run , it has performed very well and gave superior upside .
10 yrs CAGR returns for lump sum and SIP investments
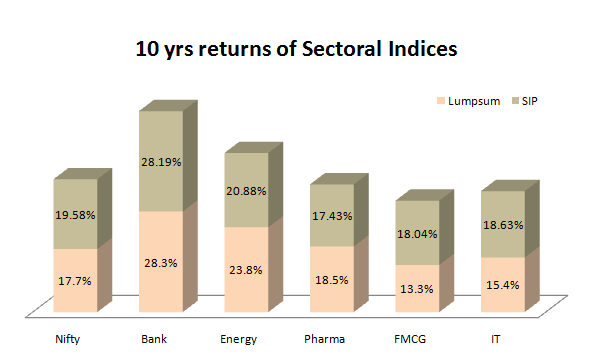
The following chart gives you CAGR return of last 10 yrs for both lump sum and SIP . Note that the values are approx only .

5 yrs performance [Lumpsum Investment]
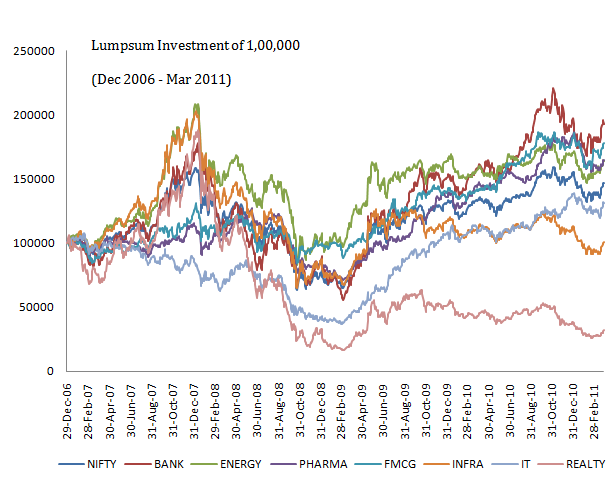
Now we will look at 5 yrs performance of various indices . The chart below shows the sectoral performance + Nifty for a lump sum investment of Rs 1 lac in last 5 yrs .

Observations
- Bank Nifty still leads the pack , the other sectors too performed good and are marginally poor . Nifty , Pharma and Energy come next best .
- Reality sector was one of the best performers till 2007 , but then its performance went down and its gave a very high negative return on CAGR basis . When other indices gave above 10% returns on average, Reality index averaged -20% CAGR return .
- Energy index has not made much movement in last 2 yrs from 2009 – 2011 , whereas Bank Nifty has doubled .
5 yrs performance [Daily SIP Investment]
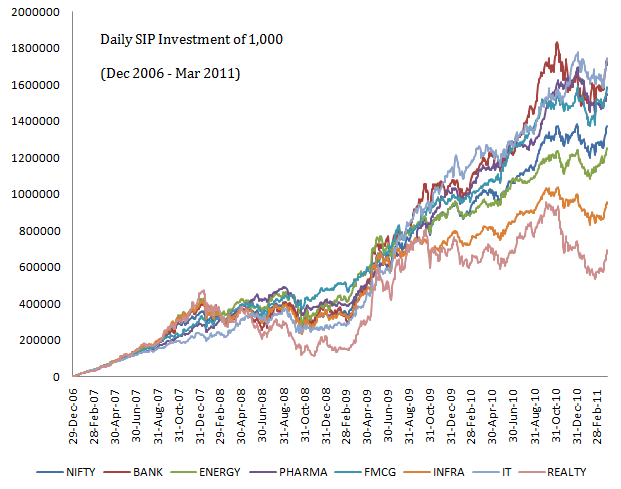

Observations
- On 5 yrs SIP basis , IT sector has clearly outperformed other sectors and it was very consistent in that . Bank Nifty comes second.
- Reality and Infra sector has performed badly and given close to ZERO return in last 5 yrs .
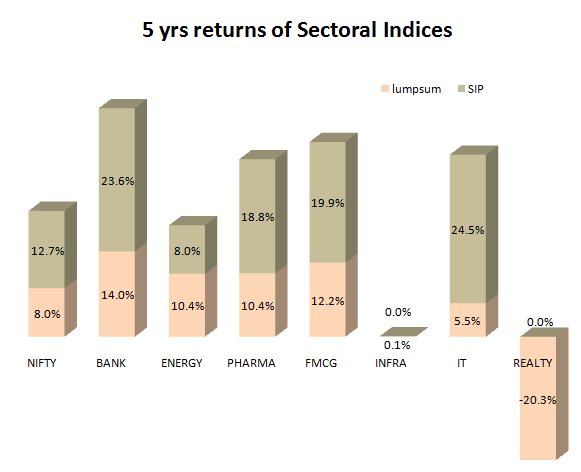
5 yrs CAGR returns for lump sum and SIP investments
The following chart gives you CAGR return of last 5 yrs for both lump sum and SIP . Note that the values are approx only .

Please share what other information were looking from an article like this . Share your comments about the article .
How did you like the information ?