Now, Stocks too have a MRP Tag
POSTED BY ON August 15, 2010 COMMENTS (27)
Have you ever asked what is the MRP of a stock ? I don’t think so !
The reason many investors shy away from investing in stock markets is because it seems to be a gamble. With the markets fluctuating every day, dropping or rising at the slightest bit of concern or euphoria, one is bound to be wary of putting one’s hard-earned money here.
And most of us experienced the worst of this volatility during the market crash in 2008; some of us are still recovering from its aftermath. So, how can we ensure that there won’t be a repeat of this scenario? How do we ensure that we do not lose our shirt at the market and make our hard earned money grow into wealth?
We all know that it is important to invest in fundamentally strong companies.
But what is equally important, if not more, is to invest at the right price. But how do we find out the right price for stocks?
Whenever we shop for anything, we are guided by a MRP tag on the wrapper or pack. Unfortunately, we do not have such a MRP tag to guide us when we buy stocks, do we? Well, now you can even have a MRP tag for stocks!
Stocks@MRP can be a great tool for investors to make sensible buy and sell decisions based on fundamentals and not on market sentiments. MoneyWorks4me, have labelled stocks with a MRP tag; something which each one of us can understand and relate to.
What is Stock@MRP based on ?
This price tag for stocks is based on the factor which primarily drives the price of a stock in the long-term – the earnings power of a company. The concept of MRP is based on the fact that, while in the short term, stocks might be affected due to news, sentiments, FII movements etc. over the Long term, the market will invariably reflect a stock’s intrinsic value based on its earnings.
MRP is a tool which helps you to gauge whether the market is under reacting or over reacting to these. As sensible investors, we would be well served if we bought stocks at a considerable discount (ideally 50%) to their MRP and sold off stocks if they are priced considerably above their MRP.
To verify whether this method could have worked well during different time periods, good times as well as bad times, we back tested it for the period 1999-2010 and found that the results are quite gratifying.
Let’s understand this concept with the example of Wipro.
The graph below shows two lines. The Red line is Wipro’s actual stock price for the period 1999 to 2010, whereas the green line is Wipro’s MRP for the same period as calculated by us based on its fundamentals.
The graph shows that Wipro was considerably overvalued for the period 1999-2001 during the Tech bubble. The company was quoting great numbers with a 60% growth in earnings (9 year CAGR growth rate) from 1990 to 2000. Add to it the euphoria of anything related to the IT industry during this period and you see Wipro quoting at as high as 400 times its earnings.
On the other hand, the MRP offers a better view on the intrinsic value of the stock based on its earnings. Not surprisingly then, as the bubble burst the price rocketed down and reached its MRP. From 2001 onwards, Wipro’s price remained close to its MRP, thus indicating that the stock was more or less fairly valued.
Wipro quoted above its MRP values from March 2005 to December 2006.
In March 2006, it was trading at as much as 30% above its MRP. Thus, it is evident that the market was expecting above average earnings in the next few quarters; a difficult thing to achieve continuously.
The EPS for the company grew at an average of around 8% during this period on a Q-o-Q basis. This was a good time to sell the stock as the price rise was not supplemented by a huge rise in earnings.
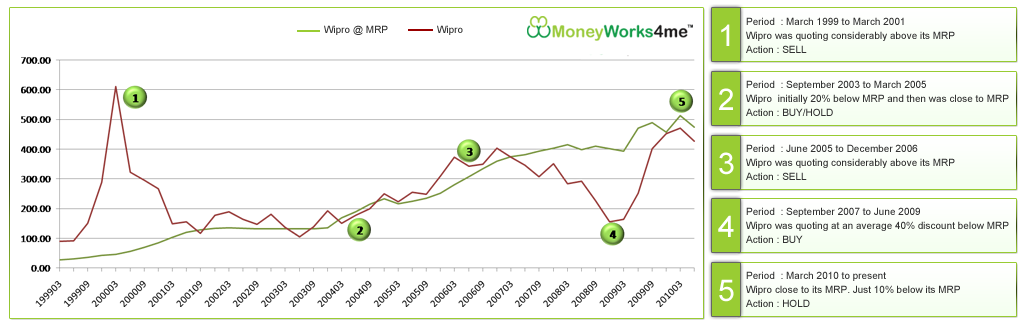
However, things started turning south for the company post december 2006 with the PE contracting. The company registered a Q-o-Q drop in EPS in June 2007 and it seems the market over reacted to this with the price reaching as much as 20% below the MRP. The company’s earnings registered a drop, again, in June 2008.
Also, after reaching a peak in January 2008, the Sensex started plummeting with the fear of a global economic recession on the cards. Wipro was available at a discount of as much as 60% in December 2008 and March 2009; a clear buy indication.
Within 2 quarters the price of Wipro reached close to its MRP giving an investor, returns of around 50%. Today Wipro is quoting at around 10% discount to its MRP and therefore one should wait for it to come to lower levels to enter. (Read Nifty PE analysis)
Margin of safety
We all know about great value investors like Benjamin Graham and Warren Buffet, who insisted on always buying stocks with a margin of safety. However, it becomes difficult to confidently ascertain what the intrinsic value of a stock is and hence we end up paying a premium for a stock instead of buying it with a margin of safety.
Stocks@MRP helps you to ascertain the intrinsic value of stocks thus ensuring that you always buy stocks which are at a discount to the MRP. As seen in the case of Wipro, following this strategy would have yielded great returns and that too at minimal risk .
Outlook Profit magazine has published a special story on this concept titled “The Right Price” in their issue dated 9th July 2010. The concept can prove to be a very useful tool for investors, enabling them to enter stocks at bargain levels and exit when things start getting over-exuberant!
You can read more about this concept on our blog Stock Shastra. In the subsequent post, we will see how this concept can be extended even to the benchmark index Sensex. We will also take a look at a few stocks which are trading considerably above or below their MRP.
This is the first of a series of guest posts by Nikhil Kale from MoneyWorks4me.com.
Hi Manish
The MRP indicated was same as an Intrisinic value right. Could you plz suggest some place where I can get these kinds of charts for any stock up-to-date with minimal Inputs.I have a spread sheet though but its very tedious to enter manually 10 yrs worth of data .
Thanks
No Sridhar
There is no FREE and easy date available . There are some websites which can help you on this, but on PAID basis
hi i am a mba student… i read ur theory…. it was good and simple to understand…. my doubt is that wether intrinsic value and mrp of stock are one and the same?
Dancy
Yes , they are same
Hello Manish,
As you have done great work with putting calculators in this site. which has really made easy life of many who doesnt know much more about planning/investing.
Can you also work on this funda to prepare MRP of some A level stocks ? or Can put some calculator with predefined question in calculator , by putting that value we can get current MRP of stocks.
I think this will be a one time effort and will make future life easy.
I suggest this as i personally didnt understand , how to calculate MRP. and wat data exactly needed for that.
Keep sharing good info.defenately there must be something to learn out of that… i believe ” Bat karne se bat banti he”
Regards
Jig
hello to all,
Stock market is only the waste of time and money and even mind,
please don’t mind, it’s my personal view.
enjoy
Vijay
Why do you say so ? Have you traded or invested in stock market and with what knowledge and learning ? If you have invested or traded on tips and just gut feeling , definately you are right .
Manish
Vijay,
As Manish said, it would be really great if you could share why you feel that stock market is only a waste of time and money.
My view is it may seem to be a waste, if we do not have the right knowledge or way to invest in the stock markets. What do you feel?
Thanks
Nikhil,
How do I see above kind of charts (MRP Vs Actual) in the Trial version?
-Puneet
Puneet
These charts (MRP Vs Actual Price) were done as part of a backtesting study for the concept of MRP. They are not available as a part of either the trial or annual subscription.
The intention behind backtesting the concept was to see its efficacy over a long term.
Thanks.
Nikhil, this is an interesting concept! I did check out your site. I was planning to subscribe to it. However, I’m apprehensive! I wonder why you don’t have a demo or a trial based subscription. Clearly, you are new in the market. Without even trying you I don’t think customers would come to you. You should think of introducing a trial so that folks can explore services you provide and feel comfortable.
Pavan,
Thanks for your feedback. We do have a demo for the site and a trial subscription as well. The demo can be found on the homepage itself (check for the yellow box. Wonder how you missed it 🙂 ). Here is the link for the 1 month trial subscription.
We also have a live chat feature so do let us know in case you have any other queries.
Thanks!
Great Job Nikhil. thanks for sharing
I liked the concept of stocks@MRP. i personally believe in value buying. and most challenging part is to arrive correct price. I applied warren/Benjamin and many other long term principles and found out that it works well. One just need to be patient 🙂 best example in my portfolio is tata motors. I was buying tata motors at various stages from 550/- to 150/- and recently exited from same with 28% returns (using XIRR method) .
Cheers
Marshal
Marshal,
Thanks a lot. Value Investing is definitely the way to go. As you rightly said, you need to be patient and not fret about short term losses, if any. If it is a fundamentally strong company, you can in fact accumulate more of it at lower prices.
Hi,
I just have one question, if this method is so full proof, why dont i see owners of moneyworks4me in india’s richest list?
As long as I understand, with my experience, stocks should be picked following own theory. Others theory doesnt click for you.
@Amrut, your concern is valid but there is no “method”. It is just another number that moneyworks4me has introduced – in addition to various other metrics on a stock. moneyworks4me does not tell a formula to decide whether to buy/sell/hold a particular stock, so this “MRP” is useless.
Vishal,
Have already shared the link for the details of the method and formulae for calculating the MRP. Do go through it and share your views.
Amrut,
Is this method the most ultimate, most effective, full proof – No definitely not. Like any other method, it has certain limitations which have been discussed in the second post. As far as India’s richest list is concerned, that’s one of the goals, not just for us, but for everyone I guess. The only regret we have here is we didn’t start earlier. 🙂 You can read more about us here: http://www.moneyworks4me.com/About-Us.html
You are also right in pointing out the each one should have his own method for selecting stocks. Our method is based on Value Investing principles. We believe that over the long term the price of the stock is primarily driven by the earnings and nothing else. This principle is what drives the calculation of the MRP. And further to protect yourself from the inherent risk in the stock market you need to buy stocks at a discount to its intrinsic worth (something which we routinely practice while buying vegetables, grocery, clothes but not stocks!) This is our theory. But as you rightly said if it does not click for you, it does not!
Manish,
WOW, first article on JagoInvestor with no comments (except mine). It’s probably because most readers are disappointed in this blog post. I’ve talked to several people and they said this post was the most out of place (read – useless) post they have seen on JagoInvestor.
Nikhil,
I applaud you for using social media to further your cause. However, if Stocks@MRP is such a rock solid tool in finding value…why not just create a hedge fund around it?
Sahil
Thanks for your views , That might be true to some point, however there are different kind of readers and there are people (may be less in numbers) who would be interested to read these stuff too ..
Manish
Sahil,
We appreciate your views. We believe that Stocks@MRP is a great tool to find value in the market if you are a long term investor looking at fundamentals. This is also substantiated by the rigourous back testing done for the model. Maybe the presentation of the article was not to your liking. Thanks none the less.
Hi Nikhil,
I have some doubts regarding your concept, would like to discuss one by one: (May be this can be helpful for other readers also)
In above chart of Wipro – what was the right time to buy(Price & Date)?
Hi Hemant,
In June 2003, Wipro was quoting around Rs. 105, at a 20% discount to its MRP. This was a relatively good time to enter Wipro ( though not the best, ideally we are looking for a 50% discount). Wipro has rarely been at a considerable discount to its MRP. The best opportunity, quite predictably, was from September 2008 to June 2009 when Wipro was trading at Rs. 160 – Rs. 200 level, at an average of more than 50% discount.
@Nikhil : this is just handwaving. Anyone can tell in hindsight when sell a stock should have been bought or sold. Even without using the concept of “MRP”, the answer for hindsight investment time would be the same.
Where is a real heuristic to determine when to buy/sell? This means an objective, mathematical function which takes as input data published by a listed company (e.g. stock price history, PE, CEO salary, colour of trademark logo, anything you like) and gives out one of the three as output – buy / sell / hold.
Vishal,
The graph for a period of 10 years may give you the impression that the buying and selling decisions are based on hindsight. But the intention behind giving the graph was to only show that the concept applies for a long term. You will agree that the market gives you opportunities to buy a stock considerably below its intrinsic worth and there are times when it values the stock considerably above its worth. And to get the confidence that this indeed happens, one has no option but to look at the past.
Also, it is not only about hindsight. The current MRP for a stock is arrived at by also considering the future growth prospects. So, when you consider this MRP, you get an idea of what your decision should be for now; should you be buying/holding/selling. In the graph given above for e.g. Wipro’s price is currently close to its MRP, so you should be holding.
Having said that how do you calculate the MRP for the stock? As you rightly mentioned it is based on certain parameters (but definitely not on the colour of the trademark logo). You can get the detailed methodology of which parameters go into the calculation of MRP and how it is calculated, here : http://stockshastra.moneyworks4me.com/learn/presenting-to-you-sensexmrp/
Hope this satisfies your query.
Liked it…will surely find out the mrp before buyin a stock
Thanks a lot for the appreciation, Shivang.